Mitsui & Co., Ltd. (8031) — High‑Dividend Stock Investment Report
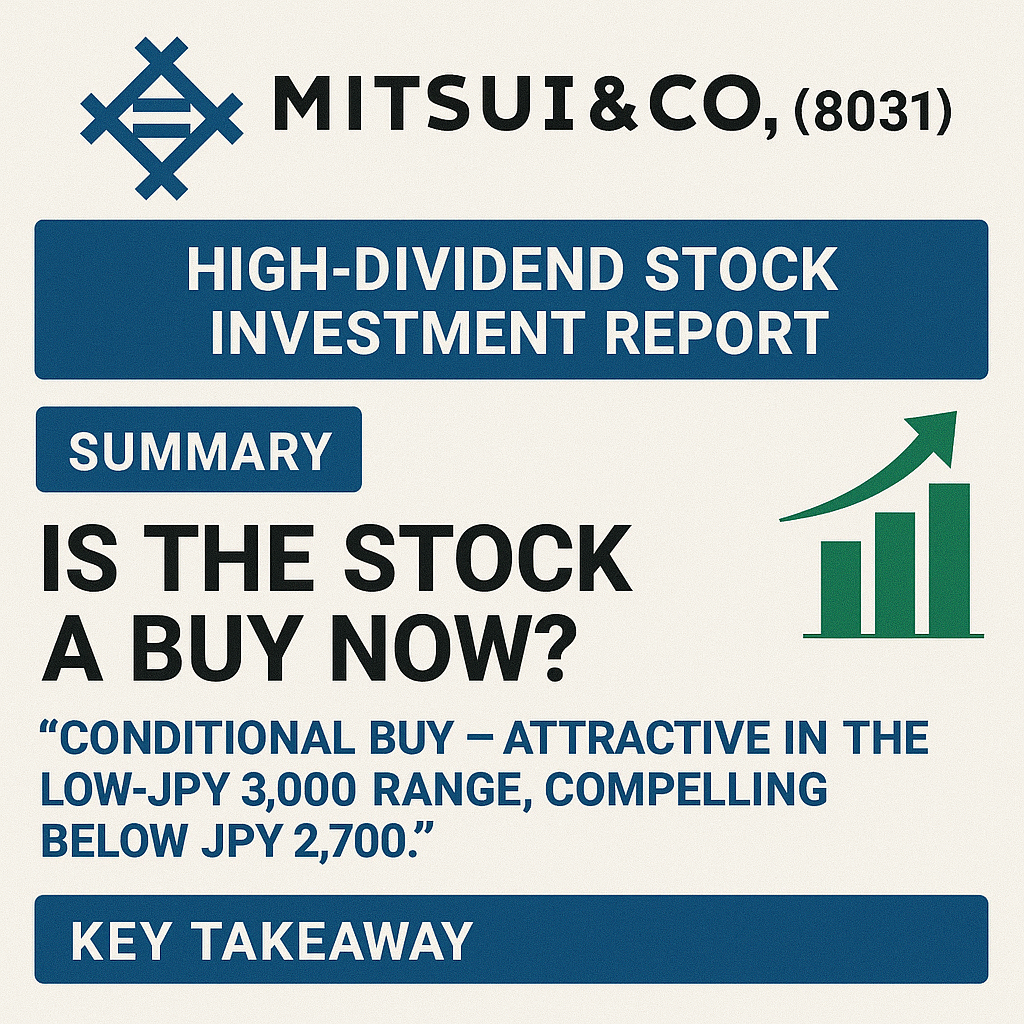
① Summary: Is the Stock a Buy Now?
Key Takeaway
“Conditional Buy – attractive in the low‑JPY 3,000 range, compelling below JPY 2,700.” Short‑term profit will level off as the commodity cycle normalises, but a six‑year dividend‑growth streak and a clean balance sheet limit downside. Long‑term upside hinges on the expansion of non‑resource businesses and disciplined asset recycling.
- Share‑Price Trend (Last 5 Years) – From the COVID‑19 bottom (~JPY 1,400) the stock climbed with rising commodity prices to an all‑time high near JPY 3,500 in Mar 2025, then pulled back to JPY 2,957.5 at the 6 Jun 2025 close (‑15 % from peak).
- Dividend Track Record & Yield – Six consecutive increases: 80 → 120 → 135 → 170 → 185 → 200 yen (FY 2026E). Current yield 3.9 %. A 4 % yield is reached at ~JPY 2,800.
- PBR & Asset Quality – PBR 1.13 ×. While toward the high end for sōgō shōsha, hidden value in resource interests, unlisted stakes and prime Tokyo real estate means little premium.
- Earnings Outlook – Net profit FY 2025 JPY 900.3 bn → FY 2026 plan JPY 770 bn (‑15 %). Mid‑term Plan 2026 shifts investment toward Wellness, ICT and Renewables while generating >JPY 800 bn operating cash flow.
Bottom Line
Near‑term (≤1 yr) – Earnings cool with softer commodity prices, but a major sell‑off is unlikely.
Medium‑term (3‑5 yrs) – Non‑resource growth and the progressive dividend could re‑rate the stock above JPY 3,500 again.
Strategy: Accumulate between JPY 2,700–3,100, lock in a 4 %+ yield and aim for long‑term capital gains.
② Business Structure & Brand Strength
2‑1 Company Overview & Business Model
Founded 1947 and headquartered in Tokyo’s Chiyoda Ward, Mitsui spans 63 countries, blending trading and investment operations into a “business‑creation” model that balances growth and risk. Market cap ≈ JPY 4.7 tn (Jun 2025).
2‑2 Revenue Mix & Competitive Position
Mitsui’s top three segments—Energy, Lifestyle, and Chemicals—generate 55 % of revenue. Among Japan’s seven major trading houses, Mitsui ranks #2 in both sales and profit, with less resource dependence than peers.
| Segment (FY 2025) | Revenue (JPY tn) | Share | Highlights |
| Energy | 2.99 | 20 % | LNG equity, renewables |
| Lifestyle | 2.50 | 17 % | Food & retail chains |
| Chemicals | 2.25 | 15 % | Basic & battery materials |
| Metal Resources | 1.49 | 10 % | Iron ore & copper |
| Machinery & Infrastructure | 1.06 | 7 % | PPP & mobility |
| Steel Products | 0.49 | 3 % | Steel distribution |
| Next‑Gen & Functions | 0.21 | 1 % | DX, finance, logistics |
2‑3 Five‑Year Performance Trend
Commodity tailwinds drove record net profit of JPY 1.1 tn (FY 2023); FY 2024 eased to JPY 900.3 bn yet remains elevated. Sales rose from JPY 11.7 tn to JPY 14.7 tn (CAGR ≈5 %). ROE improved from 9.7 % to a peak 18.9 %, now 15.3 %, well above the cost of capital.
2‑4 Brand, Culture & Shareholder Base
A “free‑spirited” culture and high pay (avg. salary JPY 16 m) keep Mitsui a top graduate pick. OpenWork rating 4.2/5 for autonomy and growth. While domestic trust banks hold most shares, foreign institutions such as BNY Mellon own >10 %, reinforcing governance.
③ Share‑Price Drivers & Market Perception
Key Takeaway
Short‑term range‑bound as the market digests “peak resources”; PER 13 × and PBR 1.1 × form the current support band.
Major Price Moves (2019‑2025)
- Mar 2020 – COVID crash (‑25 %).
- Oct 2021 – Oil/LNG spike (+18 %).
- May 2023 – ¥1 tn buy‑back (+13 %).
- Oct 2024 – Lower FY 2026 outlook (‑9 %).
Valuation Snapshot (Jun 2025)
- PER: 12.8 × (5‑yr range 8.5‑14.2 ×; EPS JPY 231).
- PBR: 1.13 × (range 0.8‑1.2 ×).
- Price Band: JPY 2,700‑3,400; currently mid‑range.
④ Growth Prospects & Risk Assessment
Key Takeaway
From “resources plus” to a circular, non‑resource platform. Sustained ROE > 10 % relies on non‑resource expansion and asset recycling; commodity and geopolitical shocks remain the biggest risks.
4‑1 Growth Drivers
- Non‑Resource Expansion – IHH Healthcare stake, LOGISTEED digital logistics, NA & AUS renewables, all growing at ~15 % CAGR.
- Circular Investments – Disposing ~JPY 800 bn of mature assets each year to fund new growth.
- Global Partnerships – Brookfield, Air Liquide on hydrogen & CCUS projects.
- DX – “M‑DX Platform” upgrades trading and overseas management.
4‑2 Key Risks
| Category | Example | Impact |
| Commodity Prices | Oil, copper slump | High |
| Geopolitics & Regulation | Mozambique LNG delays | High |
| FX | JPY appreciation | Medium |
| ESG | Coal asset criticism | Medium |
| Tech & Competition | Low PPA prices in renewables | Low |
4‑3 Mitigations
Hedge 20 % EBITDA, sell sub‑WACC assets ≥JPY 50 bn/yr, 2050 net‑zero pledge, raise non‑resource EBITDA share to 60 %.
⑤ Dividend Policy: Stability & Growth
Key Takeaway
Progressive dividends plus tactical buy‑backs deliver both income and growth.
5‑1 Framework
- Floor: Greater of 33 % of operating cash flow or DOE 4.0‑4.5 %.
- Capital Efficiency Trigger: Extra buy‑backs if ROE > 10 %.
5‑2 DPS & Payout (FY 2021‑2026E)
| FY | DPS (JPY) | YoY | Payout* |
| 2021 | 80 | – | 35 % |
| 2022 | 120 | +50 % | 33 % |
| 2023 | 135 | +12 % | 32 % |
| 2024 | 170 | +26 % | 33 % |
| 2025 | 185 | +9 % | 34 % |
| 2026E | 200 | +8 % | 33 % |
| *company‑reported or based on operating CF |
Current yield 3.9 %; 4 % at ~JPY 2,800.
5‑3 Buy‑Backs & Total Return
~JPY 360 bn of shares repurchased/cancelled over five years; total payout ratio ~40 %.
5‑4 Cut Risk & Resilience
No cuts in the past decade—even during the 2015 commodity slump. CF management and asset recycling buffer shocks.
⑥ PBR & Asset Quality: Still Undervalued?
Key Takeaway
Hidden upside from unlisted stakes, Tokyo real estate and resource interests—PBR 1.1 × is still a discount.
6‑1 PBR vs History
PBR 1.13 × vs long‑term avg. 0.9‑1.0 ×; justified by ROE 11‑12 % beating an 8‑10 % cost of equity.
6‑2 Balance‑Sheet Highlights
| Asset Class | Examples | Hidden Value |
| Liquidity | JPY 3.3 tn cash & equivalents | Net DER 0.48 × |
| Unlisted Equity | IHH, LOGISTEED | Often marked below fair value |
| Real Estate | Offices in Mita, Ōtemachi | Prime Tokyo sites |
| Resource Interests | AUS iron ore, LNG | Cash cows in up‑cycles |
+5 % NAV uplift via revaluation drops theoretical PBR to ~1.03 ×.
6‑3 Capital‑Efficiency Agenda
Asset recycling (~JPY 800 bn/yr), ROE > 10 % commitment, 50 % outside directors—driving better market dialogue.
6‑4 Investment Implications
Continued governance‑led asset sales and buy‑backs could move PBR to 1.3‑1.4 × (~JPY 3,600). Main downside risk: commodity slump hurting asset values, mitigated by liquidity and diversification.
⑦ Disclaimer
This article is intended solely for informational purposes based on publicly available data and the author’s personal opinions. It does not constitute investment advice or a solicitation to buy or sell any securities. Readers should make investment decisions at their own discretion and consult with licensed professionals if necessary. While we strive for accuracy, we cannot guarantee the completeness or timeliness of any information presented herein. Figures and information may change over time.

