Educational research only, not investment advice. Market data changes frequently. See the full Disclaimer.
Note: Itochu conducted a 1-for-5 stock split on December 29, 2025. All share prices have been adjusted to post-split values. DPS figures are shown in post-split terms with the original pre-split value labeled for reference..
Disclosure: This article contains affiliate links to TradingView. We may earn a commission at no extra cost to you.
I keep coming back to Itochu every time someone asks me which Japanese trading house is the “safest” dividend grower. The answer isn’t the one with the biggest commodity book — it’s the one that owns your convenience store lunch. — DividendDan
Investment Thesis | Last updated: June 2026
Author’s View: Neutral (Accumulate on Pullbacks) | Fair Value Estimate (Author’s Model): ¥1200–¥1300 entry zone
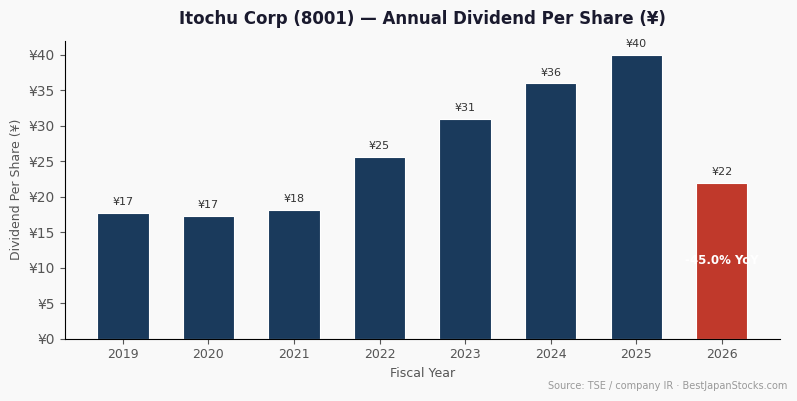
- Itochu’s downstream-first strategy — anchored by FamilyMart and consumer-facing segments — insulates earnings from commodity cycles better than any peer, supporting nine consecutive annual dividend increases with FY 2025 DPS at ¥40 (¥200 pre-split).
- FY 2025 net profit ¥880.3 bn; FY 2026 target ¥900 bn with ROE above 12%; current yield approximately 2.7% at recent prices — compelling only below ¥1300 where yield approaches 3%+.
- Key risk: PBR of roughly 2.07–2.34× leaves limited margin of safety if global consumer spending softens or the yen strengthens sharply.
Disclosure: Educational content only, not investment advice. The author does not currently hold positions in stocks mentioned. See Disclaimer for FTC 16 CFR Part 255 compliant details.
| Metric | Value |
|---|---|
| Stock Price (JPY) | ¥1,949.50 (May 22, 2026) |
| Dividend Yield | ~2.15% (approx. 3%+ at ¥1300 pre-split ref.) |
| DPS (FY 2025) | ¥40 (¥200 pre-split) |
| P/E Ratio (TTM) | ~15.23x |
| PBR | ~2.07–2.34x |
| Market Cap | ~¥15.45 trillion (~$98B USD) |
| FY 2025 Net Profit | ¥880.3 billion |
| FY 2026 Net Profit Target | ¥900 billion |
| ROE Target (FY 2026) | >12% |
| Consecutive Dividend Increases | 9 years |
| ADR Ticker (OTC) | ITOCY |
Most US investors who follow Warren Buffett’s 2020 bet on Japanese trading houses assume the thesis is a simple commodity play. Buy cheap conglomerates, collect dividends, wait for resource prices to rise.
Itochu (TSE: 8001) breaks that assumption entirely. It is the one sogo shosha that has spent two decades deliberately shrinking its resource exposure while building one of Japan’s largest consumer ecosystems.
That structural difference is precisely why it deserves its own analysis — and why entry price matters more here than with almost any other name in the sector.
What Makes Itochu Different from the Other Sogo Shosha
Japan’s five major trading houses — Mitsubishi, Mitsui, Itochu, Sumitomo, and Marubeni — are often lumped together as a single “Buffett trade.” That framing obscures critical differences in business mix.
Itochu’s defining characteristic is its Consumer & Retail segment, anchored by FamilyMart. With over 24,000 stores across Japan and Asia, FamilyMart contributes steady, recurring cash flow that has almost nothing to do with iron ore or LNG prices.
This downstream tilt is not accidental. Itochu’s management has explicitly pursued a “non-resource first” philosophy for over a decade, as documented in its medium-term management plan (中期経営計画).
The result: when commodity prices collapsed in 2015–2016, Itochu was the only major sogo shosha that avoided a dividend cut. That track record is the foundation of its nine-year streak.
Among peers, Mitsubishi and Mitsui carry heavier resource exposure. Marubeni leans on agriculture and power; Sumitomo on real estate and infrastructure. Itochu’s consumer tilt is genuinely differentiated — and for a US income investor, that means lower earnings volatility tied to commodity cycles.
One data point US investors cannot easily access: employee reviews on OpenWork (openwork.jp) — Japan’s equivalent of Glassdoor — show Itochu scoring approximately 3.6/5 for overall satisfaction, above the sogo shosha sector average. Management quality and work-life balance scores are cited as above-peer.
This is a useful proxy for organizational health that doesn’t show up in Western financial databases.
Japan Edge: Dividend Track Record and the FY 2026 Outlook
Itochu has raised its annual dividend every year for nine consecutive years. FY 2025 DPS stands at ¥40 (¥200 pre-split), up from ¥32 in FY 2023 (¥160 pre-split).
Management’s stated policy is a minimum payout ratio of 30% of net profit, with a floor guarantee — meaning dividends will not be cut even if earnings dip modestly. This floor policy is detailed in the 配当方針 (Dividend Policy page, Itochu IR).
FY 2026 guidance targets net profit of ¥900 billion. If the payout ratio is maintained, DPS could reach ¥42–¥44 (pre-split: ¥210–¥220). At an entry price that delivers a 3%+ forward yield, the income case becomes genuinely competitive with US dividend growers.
For US dividend investors in the 50–65 age bracket building income-oriented portfolios, yen-denominated dividend growth offers a meaningful diversification argument against USD-only income streams.
The 伊藤忠商事 integrated report (統合報告書) (Integrated Annual Report, Japanese) details the multi-year dividend growth trajectory alongside capital allocation priorities — worth reviewing before committing capital.
The FamilyMart Earnings Engine
FamilyMart was taken private by Itochu in 2020 through a tender offer, giving Itochu full consolidation of its earnings. This was a deliberate strategic move to deepen consumer exposure.
Convenience stores in Japan operate on remarkably stable economics: high-frequency purchases, franchise fee income, and financial services (ATM, bill payment) layered on top of retail. The model is relatively recession-resistant compared to industrial or resource trading.
FamilyMart’s Asian expansion — particularly in Taiwan and Thailand — adds a growth dimension that pure-play Japanese domestic retailers lack. This international footprint is tracked in Itochu’s EDINET 有価証券報告書 (Annual Securities Report).
Recent strategic moves reinforce the consumer-first direction. In February 2026, Itochu acquired Itochu Shokuhin for ¥78.4 billion, deepening its food supply chain. It also formed a capital alliance with Bookoff to source reuse products at FamilyMart stores — a creative move that monetizes Japan’s secondhand economy through the convenience store network.
Japanese retail investor sentiment on Minkabu (みんかぶ) — a domestic stock discussion platform US investors cannot easily access — reflects broadly positive views on FamilyMart’s earnings stability, though some posters flag concern about domestic saturation. This ground-level sentiment is a useful cross-check against institutional analyst consensus.
Buffett’s Stake and What It Does (and Doesn’t) Mean
Berkshire Hathaway disclosed stakes in all five major sogo shosha in 2020 and has since increased its holdings. Itochu is part of that basket.
Some analysts have suggested that Itochu’s consumer-oriented model could be consistent with Berkshire’s long-standing preference for businesses with durable competitive moats and predictable cash flows. This is speculative pattern-matching, not a prediction.
This remains pure pattern-matching speculation. I have no insider knowledge. Investors should not buy 8001 on the assumption that Berkshire will increase its position further.
What Berkshire’s involvement does confirm is that global institutional investors view the sogo shosha sector as undervalued relative to Western conglomerates on a book-value and earnings basis. Itochu’s TSE Corporate Governance disclosure (JPX) shows ongoing capital efficiency improvements consistent with that thesis.
Valuation: Why Entry Price Matters Here
As of May 2026, Itochu trades at a PBR of approximately 2.07–2.34× and a P/E of roughly 15.23×. That is not cheap by Japanese standards, where many industrials still trade below book.
The P/E is reasonable for a company growing net profit at mid-single-digit rates annually. But it leaves limited downside cushion if FamilyMart same-store sales disappoint or if a stronger yen compresses overseas earnings in JPY terms.
The author’s fair-value estimate reflects a scenario where yield reaches 3%+ and PBR compresses toward a more conservative level. That entry zone would represent a meaningful drawdown from recent highs — patient capital is rewarded here.
Dollar-cost averaging — buying fixed USD amounts monthly — is a practical approach for US investors who want exposure but are uncomfortable with the current valuation. You can track Itochu’s price history and RSI levels on TradingView to identify potential pullback entry points.
FX Risk: The Hidden Variable for US Investors
Every yen-denominated dividend is worth fewer dollars when the yen weakens. The JPY/USD rate has swung from approximately 110 to 155 over the past three years — a 40% move that dwarfs most dividend yields.
For a US investor holding Itochu in a taxable account, FX gains and losses are also taxable events in the US. This adds complexity that pure US dividend stocks do not have.
The counter-argument: a strengthening yen — which many analysts expect as the BOJ normalizes rates, per 日本銀行 金融政策決定会合 主な意見 (BOJ Meeting Minutes) — would boost USD-equivalent dividends and total returns simultaneously. FX risk cuts both ways.
For IRA holders: Japanese withholding tax applies even inside a traditional IRA. The 15.315% treaty rate cannot be reclaimed via Form 1116 inside a tax-deferred account. Confirm treatment with your broker before placing the trade.
Risks and Counter-View
A balanced analysis requires acknowledging where the thesis can break down:
- Valuation risk: At 2.07–2.34× PBR and 15.23× P/E near multi-year highs, any earnings miss could trigger a sharp re-rating. The margin of safety is thin at current prices.
- FamilyMart saturation: Japan’s convenience store market is mature. Domestic same-store sales growth is structurally limited by demographics and competition from Lawson and 7-Eleven. Asian expansion is promising but carries execution risk.
- Residual commodity exposure: Despite the non-resource narrative, Itochu still operates energy and metals divisions. A severe commodity downturn would not leave earnings untouched.
- Yen strength scenario: Rapid JPY appreciation would compress Itochu’s overseas earnings when translated back to yen, potentially slowing the dividend growth trajectory.
- US-China geopolitical risk: Itochu has significant China-related trading operations. Escalating trade tensions between the US and China could disrupt supply chains and earnings.
Bottom Line — Author’s View on Itochu (8001)
Itochu is the most defensively positioned of Japan’s five major trading houses. Nine consecutive dividend increases, a FamilyMart-anchored earnings base, and a stated floor dividend policy make it the closest thing to a “dividend aristocrat” structure in the sogo shosha universe.
The problem is that the market knows this. At a PBR of 2.07–2.34× and P/E of 15.23×, you are paying a premium for quality. The author’s view is Neutral — accumulate on pullbacks toward levels where the forward yield approaches 3.2–3.4% and the valuation cushion improves meaningfully.
If FY 2026 net profit hits ¥900 billion and DPS reaches ¥42 (pre-split: ¥210)+, patient investors who bought the dip will have locked in both a solid yield and a capital gain. Those who chase at elevated levels accept a thinner margin of safety for the same dividend stream.
For a US investor building a Japan allocation inside an IRA or taxable account, Itochu belongs on the watchlist at current prices and in the portfolio at the right price. The 9-year dividend streak, 12%+ ROE target, and FamilyMart’s recurring cash engine are a combination that no other sogo shosha can replicate.
Frequently Asked Questions
Q: How does Itochu’s dividend yield compare to US dividend stocks, and is the streak sustainable?
At approximately 2.15–3.2% depending on entry price, Itochu’s yield is competitive with US dividend growers. The nine-year streak is underpinned by a floor dividend policy and FamilyMart’s recurring cash flows — more durable than commodity-dependent peers. Monitor quarterly earnings report (決算短信) (earnings releases, Itochu IR) for any cash flow deterioration.
Q: How are Itochu dividends taxed for US investors?
Japan withholds 15.315% at source under the US-Japan tax treaty. You can claim this as a foreign tax credit on IRS Form 1116, offsetting US federal tax owed on the same dividend. Note: holding Japanese stocks inside a traditional IRA does not eliminate the Japanese withholding tax — verify treatment with your broker and tax advisor.
Q: Does Itochu offer 株主優待 (shareholder perks)?
Itochu does not currently operate a formal 株主優待 program for general shareholders, so this is not a factor in the US investor thesis. The dividend and capital appreciation case stands independently.
Q: What is the biggest risk specific to Itochu versus other sogo shosha?
Itochu’s premium valuation (2.07–2.34× PBR) versus peers is the most asymmetric risk. If FamilyMart same-store sales disappoint or Japanese consumer spending weakens, the re-rating could be sharper for Itochu than for resource-heavy peers whose earnings are driven by global commodity prices rather than domestic retail trends.
Q: Is there an ADR for Itochu, or must I buy on the Tokyo Stock Exchange?
Itochu also trades on US OTC markets as ITOCY (OTC ADR). Shares can be purchased directly on the Tokyo Stock Exchange (TSE) under ticker 8001. Interactive Brokers and Saxo Bank both provide direct TSE access for US-based investors. See the How to Buy section below for details.
How to Buy 8001 from the U.S.
Itochu (ticker: 8001) is listed on the Tokyo Stock Exchange Prime Market. The stock also trades on US OTC markets as ITOCY (OTC ADR), though many investors prefer TSE direct via IBKR for tighter spreads.
International investors can access 8001 through:
- Saxo Bank — full TSE coverage, available in Singapore, Japan, and Europe; preferred for SG/Asia-based investors
- Interactive Brokers (IBKR) — direct TSE access, low FX spread, strong option for US-based investors; supports IRA accounts (verify Japanese stock eligibility with IBKR directly)
- Webull — accessible for smaller investors beginning to build Japan exposure
Note for US tax purposes: Japanese dividend withholding is 15.315% (Japan’s statutory withholding; the U.S.–Japan treaty rate is 10% where properly documented). Claim the foreign tax credit on IRS Form 1116 to offset US federal tax liability on the same income.
Account opening eligibility varies by broker and jurisdiction. I am not affiliated with any of these brokers; this is general information only and does not constitute a recommendation.
Key Primary Sources: Itochu Investor Relations (English) | 伊藤忠商事 medium-term management plan (中期経営計画) (Japanese) | 伊藤忠商事 配当方針 (Japanese) | 伊藤忠商事 earnings report (決算短信) (Japanese) | EDINET 有価証券報告書 | TSE Corporate Governance Disclosures (JPX) | 日本銀行 金融政策決定会合 主な意見 (BOJ) | 伊藤忠商事 integrated report (統合報告書) (Annual Report,
Japanese) | Minkabu (みんかぶ) 8001 (Japanese retail sentiment) | OpenWork 伊藤忠商事 (Employee reviews, Japanese)
This article is for educational and informational purposes only and does not constitute investment advice. Opinions are my own, not investment advice. The author does not currently hold positions in securities mentioned. Always conduct your own due diligence before investing. This disclosure is made in accordance with FTC 16 CFR Part 255.
See our full Disclaimer for complete disclosure details. Last updated: June 2026.
2 thoughts on “Itochu (8001): Why Buffett Loves This Trading King”
Comments are closed.