Is the Big 5 Enough? — Why It’s Time to Add Sojitz & Toyota Tsusho
1. Introduction | Why Look Beyond Japan’s “Big 5” Trading Houses?
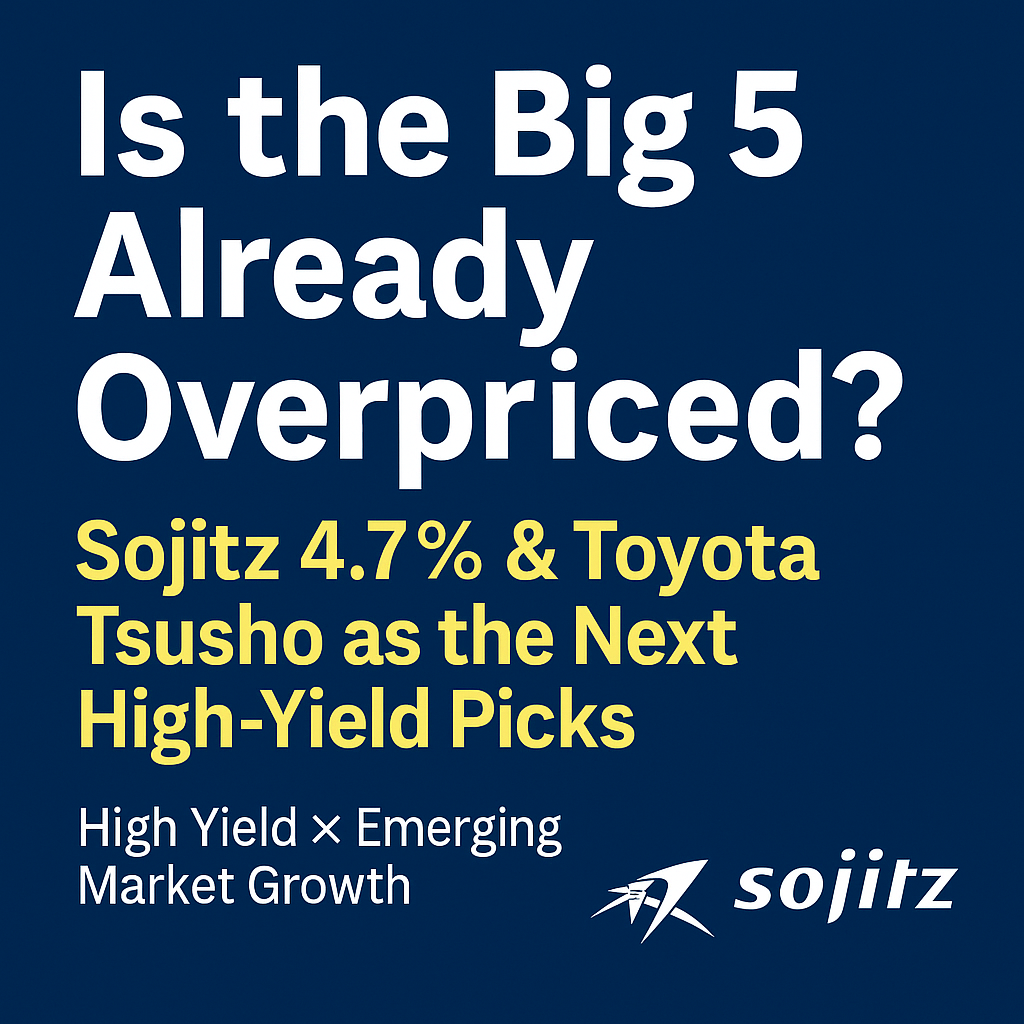
Key takeaway The recent surge in the Big 5’s share prices has squeezed dividend yields, eroding their appeal for income‑focused investors. By contrast, Sojitz and Toyota Tsusho still offer attractive yields and growth drivers the Big 5 lack, making them an ideal “missing puzzle piece” for a balanced portfolio.
Background – Big 5 rally leaves few pull‑back opportunities
- Between 2024 and 2025 the Big 5’s share‑price average rose 70 %+.
- Mitsubishi Corp. and Itochu each passed a ¥10 trillion market cap; dividend yields fell into the low‑3 % range.
- Valuations have re‑rated: Mitsubishi Corp. now trades at PBR 1.1×, Itochu at 2.1×—hardly “value stocks” any more.
The income‑investor’s dilemma
- Readers who buy only on a “progressive dividend + 4 % yield” rule now face far poorer reinvestment efficiency.
- Waiting for a 4 % pull‑back also sacrifices diversification in the meantime.
What makes Sojitz & Toyota Tsusho structurally different?
| Company | Core focus | Stand‑out strengths | Current yield* | PBR* |
| Sojitz | ASEAN fertilizer, aerospace, non‑resource 70 %+ | 2026 plan commits to DOE 4.5 % + progressive payout | 4.7 % | 0.9× |
| Toyota Tsusho | Auto value chain + Africa | Toyota Group synergy / network in all 54 African nations | 3.2 % | 1.0× |
| *Based on closing prices 6 Jun 2025; yields use FY24/25 dividend guidance. Source: FY2025 results & integrated reports (May 2025). |
Portfolio benefits
- Cheap yield: Sojitz already north of 4 %; Toyota Tsusho has ample room to reach 4 % on a pull‑back.
- Non‑resource & EM growth: Helps hedge commodity cycles and global downturns.
- Upgraded shareholder returns: Both firms pledge progressive dividends plus buy‑backs; market is slowly re‑rating them above PBR 1×.
In this series we first explain why now for these two firms by comparing them with the Big 5, then deep‑dive each company in follow‑up articles. Next up: the trading‑house model and a Big 5 overview to set clear comparison baselines.
2. Trading‑House Basics & Big 5 Snapshot
Key takeaway Japanese sōgō‑shōsha earn on two pillars—trading and equity investment. While the Big 5 share scale and global reach, they differ in resource exposure and payout policies.
2‑1. Shared structure
| Role | Examples | Revenue source | Key risks |
| Trading | Oil, LNG, grains, steel, textiles | Spread & fee income | Price & FX volatility |
| Equity investment | Copper mines, renewables, Lawson CVS | Equity earnings, dividends, disposals | Project & asset‑value swings |
Trading = cash cow; Investments = growth driver. Heavy proprietary investing means valuation is best analysed with PBR/ROE, like financials.
2‑2. Big 5 quick facts (FY2024)
| Company | Rev. (¥ tn) | Core businesses | Yield* | PBR | Notes |
| Mitsubishi Corp. | ≈22 | Resources, infra, Lawson | 3.8 % | 1.1× | Buffett stake; LNG strength |
| Mitsui & Co. | ≈15 | Energy, machinery, chemicals | 2.7 % | 1.2× | Non‑resource expansion |
| Itochu | ≈14 | Food, apparel, ICT | 3.0 % | 2.1× | Consumer‑centric |
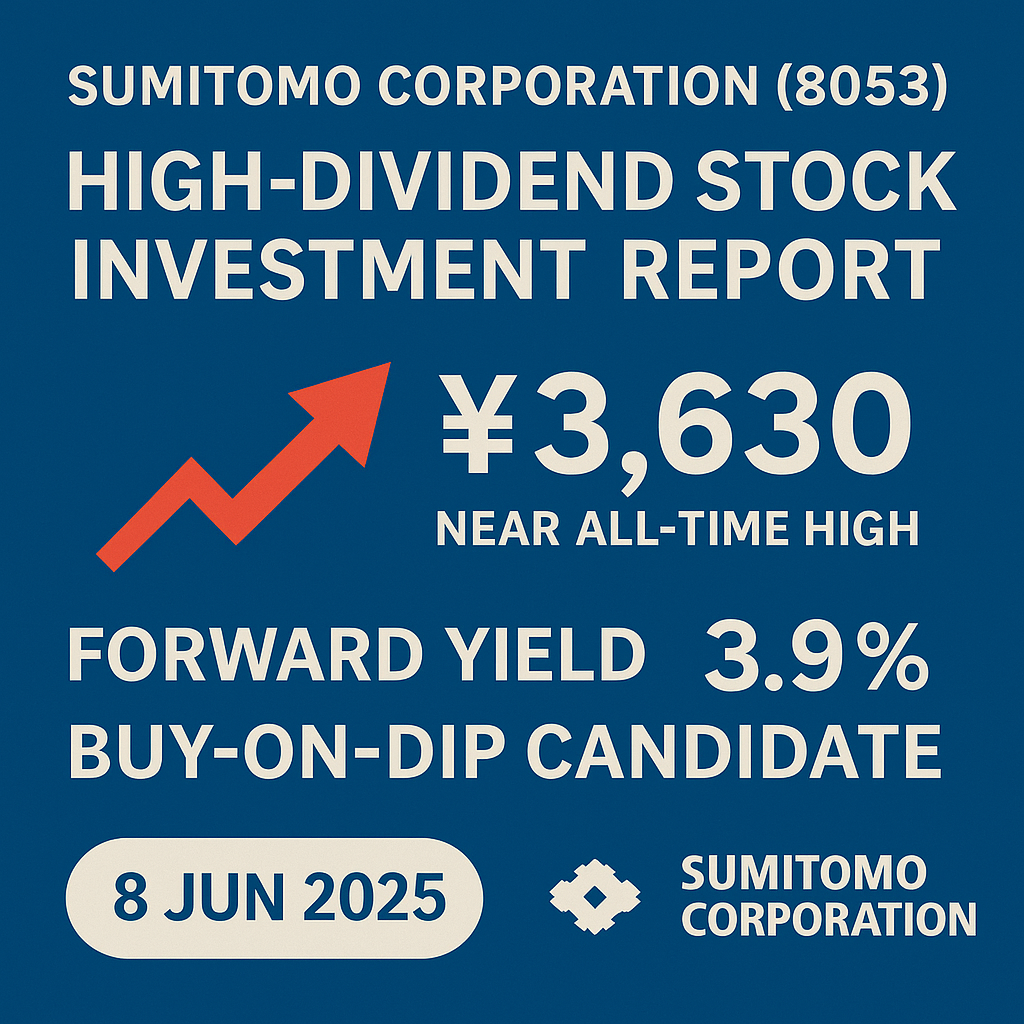
| Sumitomo Corp. | ≈8 | Metals, social infra | 3.6 % | 1.0× | Machinery & real estate up |
| Marubeni | ≈8 | Agri‑food, power, logistics | 4.0 % | 0.9× | Aggressive renewables |
| *Yields on 6 Jun 2025 close. |
2‑3. Payout similarities & differences
- All Big 5 promise either progressive or stable dividends, posting 7‑11 straight years of increases.
- Divergences:
- Mitsubishi, Mitsui — 40 % total‑return ratio + flexible buy‑backs.
- Itochu — DOE‑driven, longest increase streak.
- Marubeni — stepping payout from 25 → 30 → 40 %.
- Sumitomo — 33 % payout target + DOE cap 3 %.
Baseline set—next we compare Sojitz & Toyota Tsusho against those yardsticks.
3. Big 5 vs. Sojitz & Toyota Tsusho
Key takeaway Though smaller, Sojitz and Toyota Tsusho secure solid ROE via niche focus and agility. Valuations remain cheaper, while return policies tighten. Their geographic and sector mixes add true diversification.
3‑1. Scale & business mix (FY2024)
| Metric | Sojitz | Toyota Tsusho | Big 5 avg.* |
| Revenue | ¥2.2 tn | ¥14.3 tn | ≈¥13.4 tn |
| Op. profit | ¥115 bn | ¥430 bn | ≈¥410 bn |
| Ecosystem | Fertilizer, aircraft leasing | Toyota value chain, Africa | Resource majors, multisector |
| Edge | ASEAN agri & aerospace | Toyota tie‑up & Africa moat | Scale & resource equity |
| *Simple average of the Big 5. |
3‑2. Dividend & buy‑back stance
| Company | Fwd. yield | Price for 4 % | Inc. yrs | PBR | Note |
| Sojitz | 4.7 % | ≈¥2,550 | 5 | 0.9× | DOE 4.5 % + ¥30 bn buy‑back cap |
| Toyota Tsusho | 3.2 % | ≈¥7,500 | 8 | 1.0× | Payout lift 30 → 35 % |
| Mitsubishi Corp. | 3.8 % | ≈¥2,750 | 11 | 1.1× | 40 % total return + mega buy‑back |
| Itochu | 3.0 % | ≈¥4,700 | 12 | 2.1× | DOE 5 % progressive |
| Marubeni | 4.0 % | ≈¥1,480 | 7 | 0.9× | Phased 40 % payout target |
3‑3. Growth, geography, non‑resource tilt
| Indicator | Sojitz | Toyota Tsusho | Big 5 avg. |
| Non‑resource profit | 70 % | 60 % | ≈45 % |
| EM revenue share | 35 % (ASEAN) | 40 % (Africa) | ≈25 % |
| 2025‑27 renewables capex | ¥120 bn | ¥300 bn | ¥280 bn |
| MSCI ESG rating | BBB | A | A–AA |
Sojitz rides ASEAN agri‑food demand; Toyota Tsusho dominates Africa’s auto & renewable build‑out. Both counterbalance the Big 5’s still 50 %+ resource dependence.
4. Why These Two Are the “Next Move”
Key takeaway With Big 5 yields compressed, Sojitz & Toyota Tsusho bring cheap yield × structural growth.
4‑1. Practical portfolio add‑on
| Factor | Current Big 5 | Add Sojitz & T/T | Diversification gain |
| Sector | 50 % resources / 50 % non | 60‑70 % non‑resource | Lower commodity cyclicality |
| Region | N. America, Mid‑East, Aus. | ASEAN & Africa heavy | Capture EM growth |
| Yield band | ≈3 % | 3‑5 % | Lift income floor |
| PBR | >1.0 (re‑rated) | ≈<1.0 | Re‑rating upside |
4‑2. Re‑assessing risk & return
- Return drivers: Sojitz’s agri‑fertilizer cycle; Toyota Tsusho’s African auto boom.
- Key risks: ① EM political risk, ② Toyota sales cycle reliance (T/T), ③ Higher funding costs (Sojitz).
- Mitigation: Cap each at 5‑10 % of portfolio, consider USD‑listed alternatives where available, reinvest dividends with cost averaging.
5. Coming Up Next — Deep‑Dives
Key takeaway This was the comparison. Next articles will dissect each firm’s fundamentals for concrete investment calls.
5‑1. Scheduled topics
- Strategy & segment ROIC
- Asset quality & balance‑sheet health
- Shareholder‑return scenarios
- ESG & renewables outlook
Update policy: First deep‑dive to drop early July 2025—follow the blog and X (Twitter) for alerts!
6. Note for Overseas Investors
| Item | Sojitz | Toyota Tsusho | Details |
| ADR | None | None | No OTC symbols; trade Tokyo directly |
| Major brokers | IBKR, Charles Schwab | Same | Use tickers 2768.T / 8015.T |
| Withholding tax | 20.315 % JP source; treaty refunds possible | Same | US residents may claim credit via Form 1116 |
| FX impact | Yen dividends → USD = FX risk | Same | Yen weakness lifts effective yield |
| IR access | English site & integrated report | Same | Quarterly results often JP‑only |
Tip: Smooth FX swings by reinvesting yen dividends quarterly (dollar‑cost averaging).
7. Disclaimer
This article provides general information only and does not constitute investment advice or a solicitation to buy or sell any security. All figures (earnings, dividends, prices) are based on public data as of 6 Jun 2025 and may change without notice. Forward‑looking statements involve uncertainties; actual results may differ materially. Tax treatment varies by jurisdiction—consult a qualified advisor if needed.

