The Hidden Japanese Giant Powering Nvidia: Why Shin-Etsu (4063) is the Ultimate AI "Picks & Shovels" Play
s7たち
Best Japan Stocks

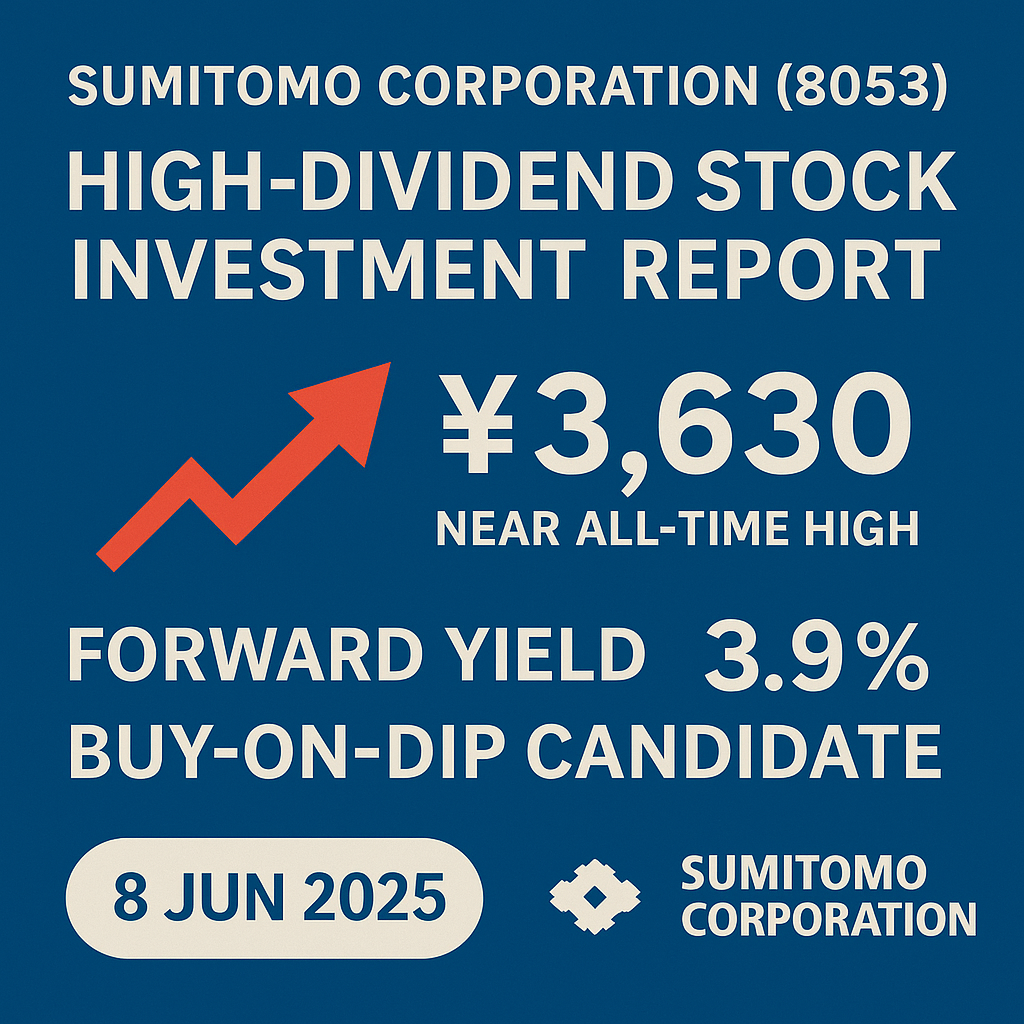
Conclusion of this section – A conditional buy. After peaking at an all‑time high of ¥3,500 in March 2025, the share price has corrected to ¥2,841 at the close on 6 Jun 2025. At this level the forward dividend yield is c. 3.5 % (¥100 DPS assumed). Around ¥3,000 the stock offers an attractive “collect the dividend while you wait” set‑up, while any dip toward ¥2,500 (4 % yield) would be a compelling long‑term entry point.
Bottom line – Volatile short‑term on resource prices, but buying near ¥3,000 offers upside skew; sub‑¥2,500 would justify an aggressive long‑term position.
| Segment | Sales Share | Key Profit Driver |
| Lifestyle | 20 % | Consumer goods & healthcare |
| Food & Agri | 15 % | Grain handling & farm inputs |
| Power & Infrastructure | 18 % | North‑American IPP, renewables |
| Metals | 22 % | Iron ore & copper stakes |
| Energy | 18 % | LNG & oil trading |
| Next‑Gen | 7 % | Digital & circular materials |
Conclusion of this section – Swings on commodities and policy hopes, but now consolidating within a ¥2,700 – ¥3,500 range. Sub‑¥3,000 trades at a discount to historical PER/PBR multiples.
| Date | Price | Catalyst |
| Mar 2020 | ¥1,400 | COVID‑19 low |
| Oct 2021 | ¥2,500 | Coal & copper rally |
| Jun 2022 | ¥3,000 | Energy shock (Ukraine) |
| Nov 2023 | ¥3,200 | ¥150 bn buy‑back announced |
| Mar 2025 | ¥3,500 | Copper > US$10k/t; GC2027 guide |
| Jun 2025 | ¥2,841 | Commodity pull‑back / profit‑taking |
Takeaway – Progressive dividend & buy‑backs cap downside; long‑term investors accumulating near range lows.
Conclusion of this section – Non‑resource pivot and circular businesses open sizable upside, but resource prices and execution on big projects pose lingering hazards. Overall risk‑return = moderately attractive.
| Risk | Description | Severity |
| Commodity slump | Iron‑ore / copper price crash | High |
| Project delays / impairment | Cost overrun in IPP or agri M&A | Medium |
| ESG regulations | Carbon tax, human‑rights compliance | Medium |
| FX / rates | Yen strength, higher funding costs | Low |
| Competition | Renewables & grain majors | Low |
Summary – Delivering the non‑resource shift and disciplined capital recycling would stabilise earnings and re‑rate multiples.
Conclusion of this section – Progressive dividend plus share buy‑backs underpin high payout visibility. ¥100 DPS looks like a floor, with upside tied to CF growth.
| FY | DPS (¥) | Payout |
| 2020 | 28.5 | 30 % |
| 2021 | 50 | 30 % |
| 2022 | 70 | 33 % |
| 2023 | 85 | 35 % |
| 2024 | 95 | 36 % |
| 2025 (plan) | 100 | 37 % |
Conclusion of this section – Nominal PBR 1.3× looks fair, but conservative book‑keeping and hidden gains imply a sub‑1× economic multiple. Further capital efficiency moves could unlock significant upside.
| Asset | Book Value | Share |
| Cash & Equivalents | ¥0.98 tn | 13 % |
| Equity‑method stakes | ¥2.1 tn | 28 % |
| Real estate & IPP | ¥1.6 tn | 22 % |
| Resource interests / inventory | ¥2.4 tn | 32 % |
| Goodwill & intangibles | ¥0.24 tn | 5 % |
The content on this website is for informational and educational purposes only and does not constitute financial, legal, or investment advice. The views expressed are the personal opinions of the author (DividendDan), based on experience as a strategy consultant and individual investor living in Japan.
Market data and company information are subject to change. Please conduct your own due diligence or consult a certified financial advisor before making any investment decisions. The author may hold positions in the securities mentioned.