Educational research only, not investment advice. Market data changes frequently. See the full Disclaimer.
60% of TSE Prime Market companies have now filed capital efficiency improvement plans — yet most US dividend portfolios hold zero yen exposure. After the February 2026 supermajority result, that gap looks increasingly hard to justify. — DividendDan
Investment Thesis
Author’s View: Constructive (selective, quality dividend names) | Fair Value Estimate (Author’s Model): Thesis-based — Nikkei re-rating toward 45,000–48,000 over 12–18 months
Last updated: June 2026
- The LDP’s two-thirds lower-house supermajority removes near-term legislative gridlock, reducing the “political discount” that has suppressed Japanese equity valuations — a structural shift, not a routine election cycle.
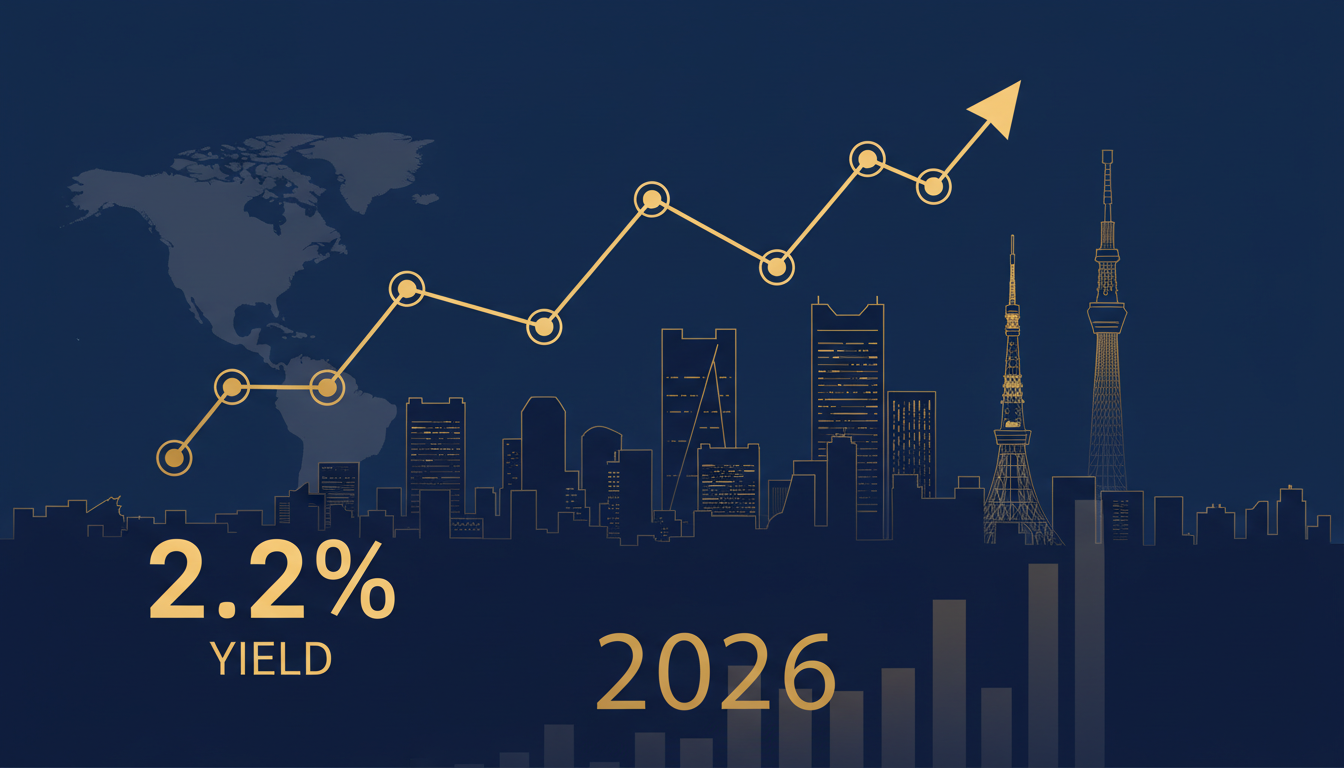
- Corporate governance reform continues: TSE Prime companies trading below book value face sustained pressure to raise ROE; average Nikkei 225 yields sit at 2.0–2.2%, with selective names above 3.5%.
- Key risk: BOJ rate normalization could strengthen the yen sharply, compressing export-sector earnings before the re-rating fully plays out.
| Metric | Value | Date / Context |
|---|---|---|
| Nikkei 225 Average Dividend Yield | 2.0–2.2% | April 2026 |
| Selective Japanese Dividend Names | 3.5–5.0% | April 2026 |
| Typical Large-Cap Payout Ratio | 30–40% | FY2025 |
| TSE Prime Companies with Capital Efficiency Plans | ~60% | Early 2026 |
| Bank of Japan Policy Rate | 0.5% | January 2025 |
| BOJ Signaled Rate Path | 0.75–1.0% | 2026 Forward Guidance |
| Nikkei 225 Forward P/E | 15–16x | vs. S&P 500 at 20–22x |
| Nikkei Re-rating Estimate (12–18 months) | 45,000–48,000 | Author Model |
The February 2026 election result deserves more attention than it has received from US dividend investors. This article explains what changed, what it means for dividend sustainability, and how to access the opportunity from a US brokerage account.
Disclosure: Educational content only, not investment advice. Current position information is not provided for this article; do not infer a holding from the thesis. See Disclaimer for FTC 16 CFR Part 255 compliant details.
The Political Catalyst: Why the Supermajority Matters for Dividends
Japan’s lower-house election on February 8, 2026 delivered the LDP and its coalition a two-thirds supermajority. This threshold allows constitutional amendments to be referred to a national referendum — and, more practically, removes the legislative friction that slowed corporate governance reforms since 2022.
According to NHK Political Coverage (日本語), the result was the LDP’s strongest electoral showing in over a decade.
For dividend investors, legislative stability translates into three concrete tailwinds. First, the government can accelerate the TSE’s “name-and-shame” campaign against companies persistently trading below book value — a program already producing measurable dividend increases and buyback announcements since 2023.
Second, fiscal policy can be executed without the budget hostage-taking that characterized coalition minority governments. Third, structural reforms — NISA expansion, iDeCo liberalization — channel domestic retail money into equities, creating a demand floor under quality dividend names.
The JPX Corporate Governance Improvement page (日本語) tracks TSE-listed companies’ responses to the “cost of capital and stock price” disclosure request. Over 60% of Prime Market companies had submitted plans as of early 2026, up from roughly 40% a year prior.
That momentum does not stall with a weak government. It accelerates with a strong one.
Dividend Landscape: What 2.2% Yield Actually Means for US Investors
The headline Nikkei 225 dividend yield of approximately 2.0–2.2% looks modest against a US high-yield dividend screen. But the comparison requires context that most US-centric analysis omits.
Japanese payout ratios remain structurally low by global standards. Many large-cap industrials and financials pay out only 30–40% of earnings, leaving substantial room for dividend growth without straining balance sheets.
The Nikkei Markets data (日経電子版) shows that total shareholder returns — dividends plus buybacks — for Nikkei 225 constituents have risen for three consecutive fiscal years through FY2025.
Many of the highest-quality Japanese dividend payers — trading companies, regional banks, infrastructure-adjacent names — carry price-to-book ratios still below 1.0x. You are acquiring assets at a discount even before the governance re-rating plays out.
The TSE news releases (東証) regularly publish updated lists of companies that have disclosed capital efficiency improvement plans — a practical shortcut for identifying reform-aligned names without needing to read Japanese IR documents in full.
Selective names within the Nikkei 225 universe yield 3.5–5.0%, well above the index average. Screening for: (a) dividend growth for 5+ consecutive years, (b) payout ratio below 50%, and (c) net cash balance sheets narrows the universe to approximately 40–60 names — manageable for a disciplined US investor. TradingView’s Japan equity screener filters this universe efficiently using yield, P/B, and payout ratio criteria simultaneously.
For US investors who cannot read Japanese, Kaisha Shikiho (四季報) is the domestic earnings intelligence source that mainstream English-language equity research does not replicate. The most recent edition shows a broad upward earnings revision bias for FY2026 across Nikkei 225 industrials.
That upward revision bias matters directly to dividend sustainability: companies beating earnings estimates in Japan have historically followed with dividend increases within 1–2 quarters, particularly now that TSE governance reform creates explicit pressure to share the upside with shareholders rather than retain it.
BOJ Policy and the Yen: The Macro Risk US Investors Cannot Ignore
No honest analysis of Japanese equities in 2026 omits the Bank of Japan. The BOJ’s gradual exit from ultra-loose monetary policy — including the January 2025 rate hike to 0.5% and the signaled path toward 0.75–1.0% — introduces yen appreciation risk that directly affects USD-denominated returns.
The BOJ 主な意見 (Summary of Opinions, 日本語) from recent Monetary Policy Meetings shows a committee cautiously optimistic about wage growth sustaining inflation near the 2% target — a precondition for further normalization.
This Japanese-language source is available only in the original Japanese for several weeks before any translated summary reaches English-language outlets. For US investors monitoring the BOJ, reading the 主な意見 directly closes a meaningful intelligence gap: the difference between “cautiously optimistic” and “data-dependent caution” in the committee’s language directly signals how quickly the next rate move arrives.
If USD/JPY moves from the current ~150 range toward 130–135 over 12–18 months — consistent with BOJ normalization — a US investor holding unhedged Japanese equities would see a currency tailwind of roughly 10–12% on top of any equity appreciation.
The flip side: rapid yen appreciation toward 120–125 would compress export earnings. A 10-yen strengthening typically reduces operating profit by 3–5% for major exporters like Toyota and Sony. The BOJ’s 経済・物価情勢の展望 (Outlook Report, 日本語) is the primary source for tracking this normalization path.
The practical portfolio response: balance export-sector names (which benefit from yen weakness) against domestic-demand names — financials, real estate, consumer staples — that benefit from yen strength and rising domestic rates. A 50/50 split provides a natural partial hedge without FX derivative costs.
Japan Edge: Governance Reform Behind the Yield
The TSE’s “comply or explain” pressure on below-book-value companies is the single most important structural driver of Japanese dividend growth over the next three to five years. Companies that previously hoarded cash — a post-bubble legacy of the 1990s — now face explicit regulatory and shareholder pressure to deploy that capital.
TSE publishes monthly lists of companies that have disclosed capital efficiency plans. Institutional investors — domestic pension funds and foreign activists alike — use these lists to prioritize engagement. Companies that fail to respond face credible threats of Prime Market index exclusion.
The EDINET (金融庁電子開示システム) is the authoritative source for actual disclosure filings, including medium-term management plan (中期経営計画) (medium-term management plans) that contain explicit dividend policy commitments. This is the primary research tool for verifying whether a company’s dividend growth pledge is backed by a formal filing.
For a US investor evaluating a specific Japanese stock, the workflow is: (1) locate the most recent medium-term management plan (中期経営計画) on EDINET or the company’s IR page; (2) check the explicit ROE target and dividend policy language; (3) verify whether the company has submitted a TSE capital efficiency disclosure.
Companies that have done all three are demonstrably more shareholder-aligned — and that alignment is what makes a 2.2% index yield sustainable and growable rather than a value trap.
Risks and Counter-View
A constructive view on Japanese equities in 2026 requires honest engagement with the bear case. Four risks deserve serious weight:
- BOJ over-tightening: If the BOJ raises rates faster than expected — driven by wage-price spiral dynamics — the yen could appreciate sharply and rapidly, compressing export earnings before governance re-rating can offset the impact. The 2024 carry trade unwind, when USD/JPY moved from ~160 to ~142 in six weeks, is a recent reminder of how quickly this can happen.
- Governance reform fatigue: The TSE pressure campaign has produced results, but corporate Japan’s pace of change remains slower than activist investors would prefer. Companies can technically “comply” with disclosure requirements while making minimal substantive changes to capital allocation — the risk is a multi-decade grind rather than a 12–18 month catalyst.
- Demographic headwinds: Japan’s shrinking working-age population creates structural drag on domestic consumption and GDP growth. For domestically-focused dividend payers (regional banks, consumer staples, retail), this is a genuine long-term earnings headwind no amount of governance reform fully offsets. The 総務省統計局 人口推計 (Statistics Bureau Population Estimates, 日本語) provides the authoritative demographic data.
- Geopolitical risk: Japan’s proximity to Taiwan Strait tensions and its evolving defense posture introduce tail risks that are difficult to price. A significant regional escalation would likely trigger a risk-off yen appreciation and equity selloff simultaneously — the worst combination for unhedged US holders.
Bottom Line — Author’s View: Constructive, Selectively
Japan’s February 2026 political inflection point is real — but so is the stock-selection discipline required to capture it. The Nikkei 225’s 2.0–2.2% average yield, 15–16x forward P/E (versus 20–22x for the S&P 500), and structurally low 30–40% payout ratios frame a credible total-return case that few global equity markets offer at current valuations.
The 2.2% index yield is a floor, not a ceiling. Selective names yield 3.5–5.0%, carry sub-50% payout ratios, and have explicitly committed to dividend growth in their medium-term management plan (中期経営計画) filings. That combination — yield, growth headroom, and valuation discount — is rare in 2026 global equity markets.
For a US investor with a $500K–$2M portfolio seeking non-correlated dividend income, a 5–10% allocation to quality Japanese dividend names — balanced between export-oriented and domestic-demand sectors — is consistent with a prudent diversification framework.
Monitor the BOJ trajectory closely. Gradual normalization (USD/JPY drifting toward 135–140 over 18 months) is constructive for total returns. Rapid appreciation below 125 warrants a tactical reduction in export-sector exposure. Position sizing and sector balance matter more here than in a typical US equity allocation.
Related Reading: BOJ Policy & Yen Outlook 2026: A Practical Framework | How U.S. Investors Can Buy Mitsubishi (8058) at 3% Yield
Frequently Asked Questions
Q: What are the tax implications for US investors receiving dividends from Japanese stocks?
Japan withholds 15.315% on dividends paid to US investors. US investors can claim this as a foreign tax credit on IRS Form 1116, effectively offsetting US tax liability dollar-for-dollar up to the credit limit.
Note that Japanese dividends are generally taxed as ordinary income rather than qualified dividends in the US — consult a tax professional for your specific situation. IRA holders cannot claim foreign tax credits on withheld amounts; the 15% becomes a permanent cost in tax-advantaged accounts.
Q: Is the 2.2% yield sustainable given Japan’s demographic challenges?
For quality names with explicit dividend growth commitments in their medium-term management plan (中期経営計画) filings, yes — the yield is sustainable and likely to grow. The demographic headwind affects domestic-demand sectors most acutely. Export-oriented industrials and global trading companies are substantially less exposed to domestic population trends.
The TSE governance reform pressure creates an additional floor under dividend policy for Prime Market companies — even demographically challenged domestics face shareholder pressure to maintain payouts once committed.
Q: Should I use ETFs or individual stocks for Japanese dividend exposure?
ETFs (such as EWJ or DXJ) offer easy access and diversification but dilute the governance-reform alpha — index funds hold all constituents regardless of capital efficiency progress. Individual stock selection, focused on companies with TSE disclosures and explicit dividend growth targets in their medium-term management plan (中期経営計画), captures the reform premium more directly.
For investors new to Japanese equities, starting with an ETF and building individual positions over time is a reasonable approach. TradingView’s Japan equity screener is a practical tool for initial filtering by yield, P/B, and payout ratio before deeper IR research.
How to Buy Japan Dividend Stocks from the U.S.
Ticker 2026 (Toyota Motor) trades primarily on the Tokyo Stock Exchange, and since the body doesn’t clearly state a US-listed ADR ticker for it, no ADR should be cited here. U.S. investors can. For step-by-step brokerage setup, ADR vs. direct TSE shares, and U.S. tax handling, see our complete guide: How to Buy Japanese Stocks from the U.S..
This article is for informational and educational purposes only and does not constitute investment advice. Opinions are my own, not investment advice. Current position information is not provided for this article; do not infer a holding from the thesis. Past performance is not indicative of future results. FTC 16 CFR Part 255: no compensation was received for coverage of any securities mentioned. Last updated: June 2026. See our full Disclaimer for complete disclosure details.
Disclosure: This article contains affiliate links to TradingView. We may earn a commission at no extra cost to you.
2 thoughts on “Why U.S. Investors Should Watch Japan in 2026”
Comments are closed.