Escaping the US Office Apocalypse? Why J-REITs Are the Safest 4%+ Yield Haven Right Now
s7たち
Best Japan Stocks
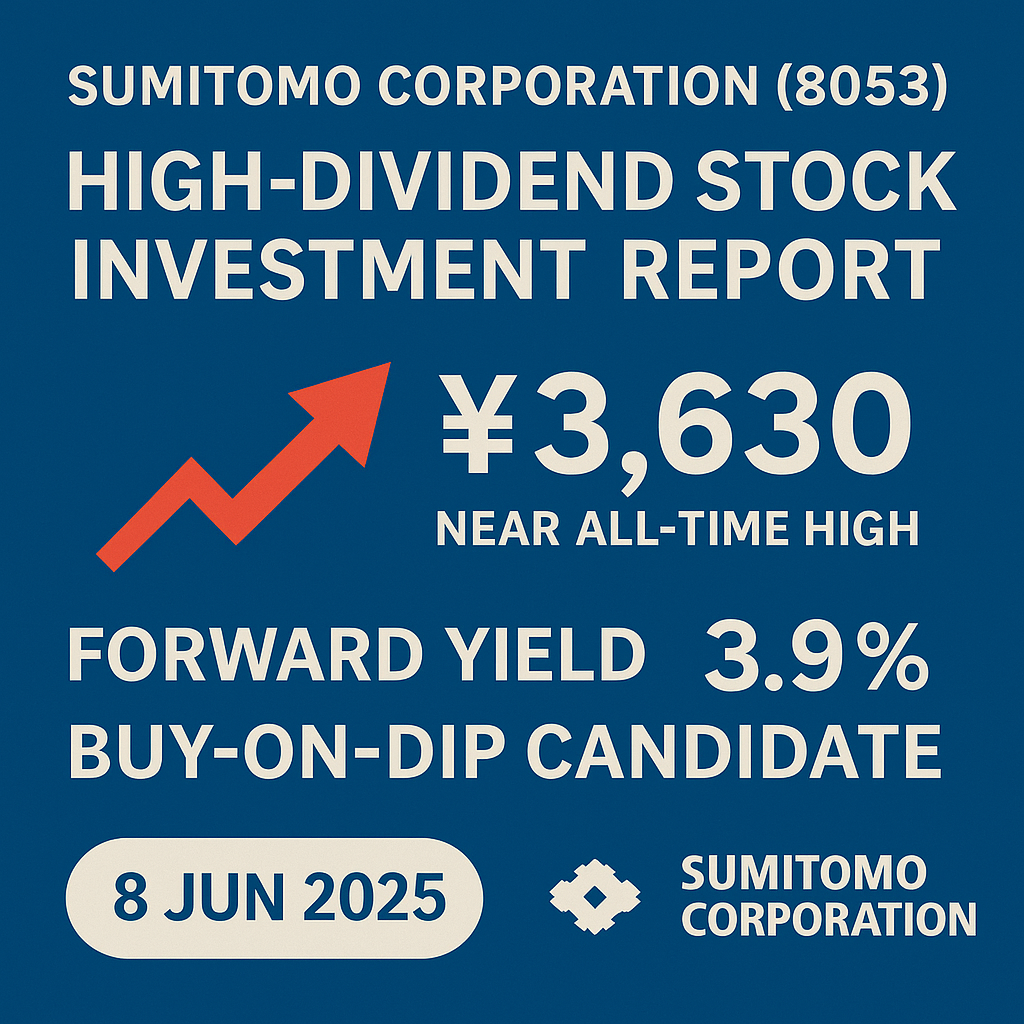
Bottom line: A buy‑on‑dip candidate. At ¥3,630 the share price is near its all‑time high with a forward yield of 3.9 %, which feels light. Yet progressive dividends and hidden assets (PBR 0.9×) underpin the downside. A pull‑back to ¥3,500 (4 % yield) or below would offer attractive long‑term income.
| Metric | Current Reading | Comment |
| Price trend | Covid‑low ¥1,200 → Mar‑2025 high ¥3,820 → now ¥3,630 | Near record high |
| Dividend track record | Five straight increases, FY 2025E DPS ¥140 | Progressive policy declared |
| Dividend yield | ¥140 ÷ ¥3,630 ≈ 3.9 % | 4 % yield at ¥3,500 |
| PBR & assets | 0.9× | Hidden gains in Tokyo real estate & listed equities |
| Outlook | MTP 2026 targets FY 2027 profit ¥650 bn, ROE > 12 % | Non‑resource growth is key |
Note for global investors: Japanese high‑dividend names often favour stable payouts over large buy‑backs; watch how Sumitomo tweaks its capital policy.
Sumitomo runs a mini‑conglomerate model. Resources still matter, but non‑resource drivers are gaining ground.
| Segment | Revenue (¥ bn) | Share |
| Metal Products | 1,607.6 | 23.3 % |
| Transportation & Construction Systems | 960.6 | 13.9 % |
| Infrastructure | 561.6 | 8.1 % |
| Media & Digital | 805.4 | 11.6 % |
| Living Related & Real Estate | 1,079.0 | 15.6 % |
| Mineral Resources, Energy, Chem & Electronics | 1,900.4 | 27.5 % |
The Sumitomo credo of “integrity and sound management” permeates the firm. Domestically, the company scores well on graduate employer rankings and is regarded as work‑life balanced for a major sōgō shōsha. That said, some staff note that decision‑making freedom varies by division due to residual seniority norms.
Keiretsu cross‑holdings still weigh on capital efficiency; follow progress on unwinding.
Takeaway: Up roughly 3× in five years. After peaking at ¥3,820 in March, the stock trades 5 % off the high. With PER 10.6× and PBR 0.9× it remains cheap vs peers, yet fading resource prices cap upside. Technical sweet‑spots look like ¥2,900‑3,100 (buy‑the‑dip) and above ¥3,800 (profit‑taking zone).
Tip: Overlay earnings dates and big M&A on your chart to visualise catalysts.
Verdict: A middle‑of‑the‑road risk/reward. Progressive dividends and a solid balance sheet cushion investors, but earnings are still swingy with commodities.
| Risk | Severity | Comment |
| Commodity price swings | High | c.30 % of profit tied to resources |
| FX volatility | Medium | Yen appreciation dents USD income |
| Carbon‑neutral regulation | Medium | CapEx up as 2050 targets loom |
| Project delays | Low | Diversified portfolio limits impact |
Global angle: Commodity beta is higher than diversified Western peers; watch hedging discipline.
Conclusion: A “never‑cut” policy. With a 40 %+ payout pledge, DPS should continue rising from ¥140 (FY 2025E) toward ¥150+ by FY 2027, backed by ample cash flow and low leverage.
| FY | DPS (¥) | Payout | Notes |
| 2021/3 | 90 | 30 % | Raised despite Covid |
| 2022/3 | 100 | 31 % | Progressive policy formalised |
| 2023/3 | 115 | 34 % | Resource boom boost |
| 2024/3 | 130 | 38 % | Closing on 40 % target |
| 2025/3* | 140 | 40 % | Company guidance (record high) |
Buy‑backs: ¥250 bn repurchased FY 2022‑25; another up‑to‑¥100 bn authorised for FY 2025.
Progressive dividends resemble UK practice; payouts rarely fall but buy‑backs proceed more slowly than in the U.S.
Call: PBR 0.9× screams discount, but some reasons persist. Real‑asset mark‑ups are under‑reflected, and efficiency reforms are still underway. Achieving the ROE goal could unlock a > 1× re‑rating.
| Asset Class | Share | Comment |
| Cash & ST investments | 18 % | High liquidity |
| Listed equities / equity‑method stakes | 22 % | Hidden surplus in resource & infra names |
| Real estate (Tokyo offices, malls) | 20 % | Estimated at 1.5‑2× book value |
| Business investments | 35 % | Focus on renewables & healthcare |
| Goodwill / intangibles | 3 % | Conservative M&A stance |
Management is trimming stakes (~¥120 bn sold FY 2024) and executing buy‑backs to lift ROE to 12 %+.
The content on this website is for informational and educational purposes only and does not constitute financial, legal, or investment advice. The views expressed are the personal opinions of the author (DividendDan), based on experience as a strategy consultant and individual investor living in Japan.
Market data and company information are subject to change. Please conduct your own due diligence or consult a certified financial advisor before making any investment decisions. The author may hold positions in the securities mentioned.