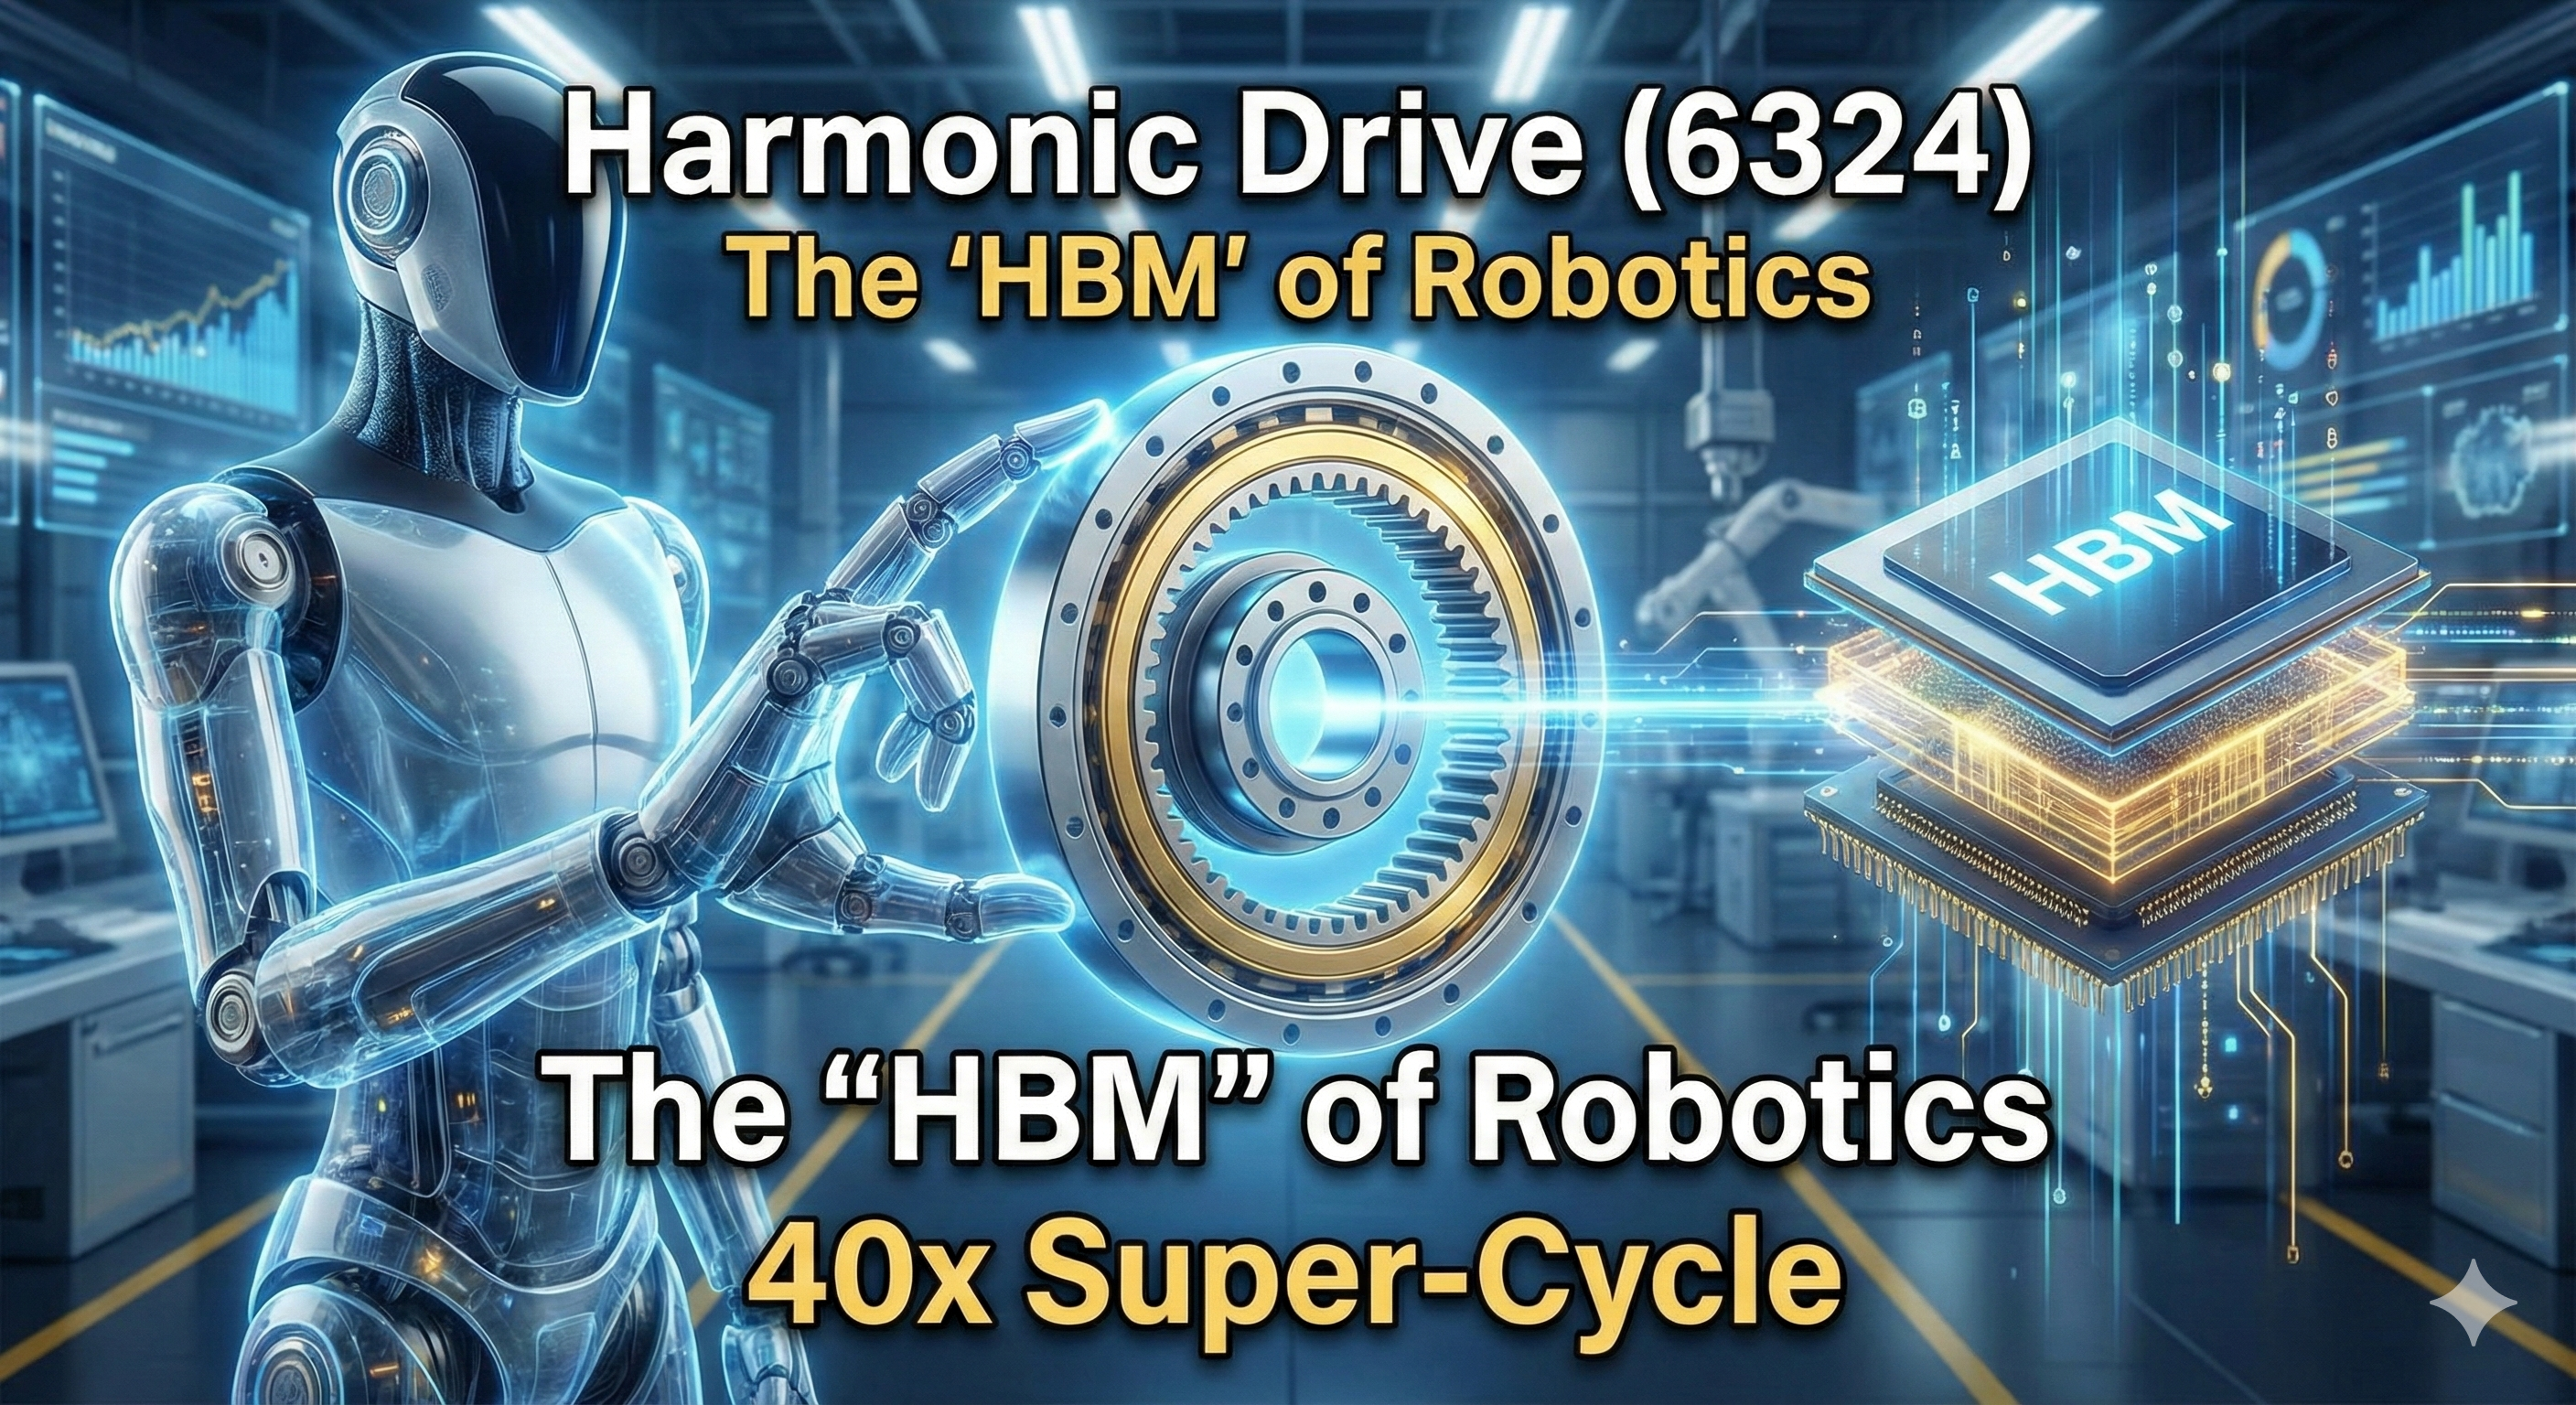
Harmonic Drive (6324): The "HBM" of Robotics and the 40x Super-Cycle of Humanoids
s7たち
Best Japan Stocks
Key takeaway
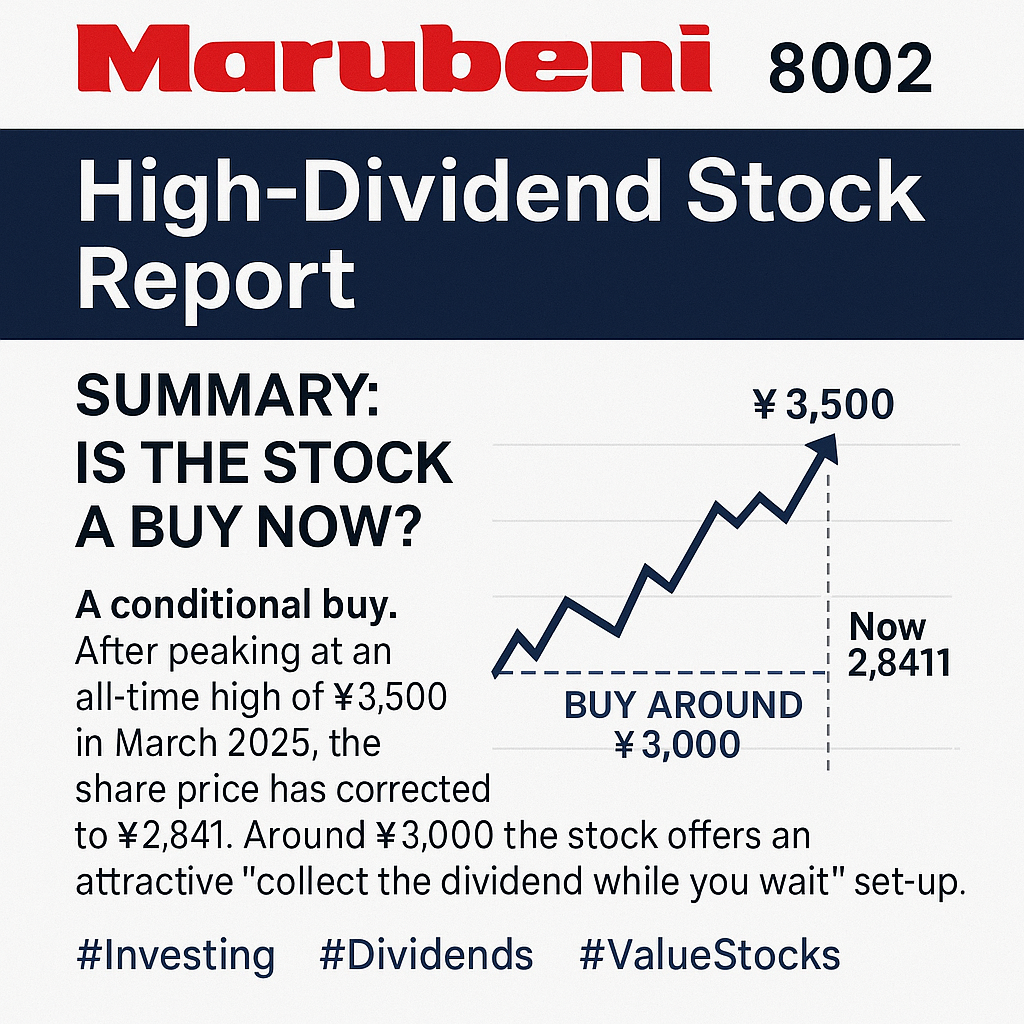
It is an attractive “buy‑on‑dips” candidate. After a mild pull‑back from its all‑time high (¥3,014 at 6 Jun 2025 close), the stock still offers a 3.6 % forward yield. If it retreats toward ¥2,750 (4 % yield), the long‑term income appeal increases materially.
| Check‑point | Details |
| Price trend | Pandemic trough (~¥1,300 in Mar 2020) → ¥3,200 in Mar 2025. Up ~2.4× in five years; now ~6 % below peak |
| Dividend trend | FY2021 ¥37 → FY2025 ¥105 (four straight hikes). FY2026 guidance ¥110 under progressive DPS policy |
| Yield | ¥110 ÷ ¥3,014 ≈ 3.6 %. A 4 % yield equates to ~¥2,750 |
| PBR / Asset quality | PBR ≈ 1.0×. Hidden gains in cross‑holdings & real estate underpin book value |
| Earnings outlook | Record net profit ¥362.5 bn in FY25; mid‑term plan targets ¥450 bn in FY27 |
Note for Overseas Investors
Japanese firms prioritise “stable/progressive” dividends but can be slow in aggressive buy‑backs. Track repurchase activity alongside yield.
Key takeaway
An 8‑division structure leverages Toyota Group sourcing power plus trading‑house agility. Growth engines: Metal+, Green Infrastructure, Africa. A string of niche‑top positions underpins high capital efficiency.
| Segment | Rev. share | Core activities |
| Metal+ | 30 % | Steel, non‑ferrous trading; EV copper/aluminium rolling |
| Mobility | 17 % | CKD vehicle export, contract parts mfg. |
| Supply‑Chain | 15 % | Parts logistics, procurement BPO |
| Green Infra | 12 % | Wind/solar, hydrogen, retail power |
| Africa | 10 % | CFAO: auto, finance, healthcare |
| Circular / Digital / Lifestyle | 16 % | Battery recycling, IT, food & medical |
Note for Overseas Investors
Toyota cross‑shareholdings could slow asset recycling. Watch progress on unwinding.
Key takeaway
The market sees Toyota Tsusho as a “growth‑flavoured defensive dividend play.” Shares sit mid‑channel of a five‑year uptrend. In the PER 12–14× / PBR 0.9–1.2× upper band, profit‑taking emerges; near a 4 % yield (¥2,750) buyers reappear.
Key takeaway
Carbon‑Neutral/Circular Economy (CN/CE) & Africa anchor the FY25‑27 plan. ¥1.2 tn CAPEX could lift ROE to 15 %, but commodity swings, EM risk, and execution remain hurdles.
| Driver | Details |
| Africa expansion | CFAO platform: mobility, infra, healthcare across 54 nations |
| Green infra | NA battery recycling, hydrogen chain, wind/solar |
| Metal+ upgrade | EV‑grade copper/aluminium, green steel supply |
| Risk | Description | Impact |
| Commodity prices | Direct hit to Metal+ | High |
| CAPEX execution | Delays / overruns on ¥1.2 tn plan | High |
| Africa geopolitics | Security & regulatory volatility | Medium |
| Regulatory shifts | EU battery rules, etc. | Medium |
| FX | Sharp JPY appreciation | Low |
Note for Overseas Investors
Long development cycles mean EPS may stall short‑term; a 3‑yr+ horizon is prudent while collecting dividends.
Key takeaway
A formal progressive DPS stance. Payout ratio 30→35 % uplift; DPS up ~3× in 10 yrs. Total payout (incl. buy‑backs) consistently >50 %. Low cut risk, but hike cadence will mirror earnings.
Note for Overseas Investors
Japan’s “progressive dividend” lacks a hard total‑payout guarantee; monitor DPS + buy‑backs in tandem.
Key takeaway
At ~1.0× PBR, Toyota Tsusho trades slightly below the Big‑5 trading‑house mean (1.1×). Substantial latent gains in Toyota shares & global real estate mean a 1.3–1.5× re‑rating is plausible if ROE stays ≥12 %.
Note for Overseas Investors
Japanese PBR discounts often stem from low‑yield assets or conservative accounting. Toyota Tsusho’s latent value is real, but must be crystallised.
This report contains forward‑looking statements based on information available as of 8 Jun 2025. Actual results may differ materially due to economic or market factors.
The content on this website is for informational and educational purposes only and does not constitute financial, legal, or investment advice. The views expressed are the personal opinions of the author (DividendDan), based on experience as a strategy consultant and individual investor living in Japan.
Market data and company information are subject to change. Please conduct your own due diligence or consult a certified financial advisor before making any investment decisions. The author may hold positions in the securities mentioned.