
| Metric | Value |
|---|---|
| Price (JPY) | Y6,535 |
| Dividend Yield | 1.67% |
| P/E Ratio (TTM) | 36.6x |
| Market Cap | Y6.1t |
| 52-Week Range | Y4,056 – Y8,880 |
Educational research only, not investment advice. Market data changes frequently. See the full Disclaimer.
Data freshness: Market prices, yields, valuation multiples, and forecasts in this article are dated snapshots rather than live quotes. Page maintenance review: July 10, 2026. Verify current quotes and the latest official IR guidance before making a decision.

Disclosure: This article contains affiliate links to TradingView. We may earn a commission at no extra cost to you.
Fanuc’s FY2027 operating income guidance of ¥212.2 billion — a 15.5% YoY beat against consensus — barely made a ripple in English-language financial media, yet Tokyo-based brokerage desks treated it as a genuine re-rating event.
Add a METI supplementary budget line that most Western analysts haven’t found, and Fanuc may be the most under-appreciated compounding story in Japanese industrials right now. — DividendDan
Investment Thesis | Data snapshot: May 2026; page maintenance review: July 10, 2026
Author’s View: Constructive | Fair Value Estimate (Author’s Model): ¥8,500
- Core thesis: FY2027 operating income guidance of ¥212.2 billion (+15.5% YoY, consensus beat) is backed by three compounding catalysts: METI’s ¥32B physical-AI robotics budget, a $90M U.S. factory hedge against tariffs, and a deepening NVIDIA collaboration embedding generative AI into CNC controllers.
- Numeric backing: FY2026 net sales +7.6% YoY to ¥857.8B; operating margin ~21.4%; dividend yield ~1.33%; ¥50B share buyback announced April 2026; PER 35–38x justified by double-digit earnings trajectory.
- Top risk: Robot Division (~45% of sales) carries heavy China exposure; US-China trade escalation could materially compress FY2027 guidance.
| Metric | Value |
|---|---|
| Stock Price (JPY) | ¥8,063 (May 2026) |
| Dividend Yield | ~1.33% |
| P/E Ratio (TTM) | 45.2x |
| Market Cap | ¥7.5 trillion |
| 52-Week Range | ¥3,650 – ¥8,880 |
| FY2027 Op. Income Guidance | ¥212.2B (+15.5% YoY) |
| FY2026 Net Sales | ¥857.8B (+7.6% YoY) |
| ADR Ticker (OTC) | FANUY |
Please review our Disclaimer before acting on any analysis here. The author does not currently hold positions in the securities mentioned.
Fanuc Corporation (TSE: 6954) sits at the precise intersection of three forces reshaping global manufacturing: Japan’s state-backed push to reclaim next-generation robotics leadership, the geopolitical imperative to localize industrial supply chains, and the NVIDIA-driven physical-AI inflection that is beginning to rewire how CNC controllers and collaborative robots think.
This article maps each of those forces against Fanuc’s financials, competitive position, and valuation — and explains why the full picture is only visible if you read the Japanese-language source material directly.
FY2027 Guidance: The Number English Media Buried
Fanuc’s April 2026 IR release — available in full on the Fanuc Japanese-language IR page — disclosed FY2027 operating income guidance of ¥212.2 billion, a 15.5% increase year-on-year.
English-language wires covered this in two sentences. Domestic brokerage desks in Tokyo treated it as a re-rating event. That gap in coverage is precisely where the investment edge lies for readers of this blog.
FY2026 full-year net sales reached ¥857.8 billion, up 7.6% YoY, with an operating margin of approximately 21.4%. These figures are drawn from the EDINET filing database and Fanuc’s official earnings report (決算短信) (earnings summary).
The ¥50 billion share buyback announced alongside the guidance further signals management’s confidence in cash generation. For US dividend investors, buybacks at a Japanese industrial of this scale are still relatively uncommon — a meaningful shareholder-return signal.
| Metric | Value |
|---|---|
| Price (JPY) | Y7,439 |
| Dividend Yield | 1.49% |
| P/E Ratio (TTM) | 41.6x |
| Market Cap | Y6.9t |
| 52-Week Range | Y3,699 – Y8,880 |
Three Compounding Catalysts
1. METI’s ¥32 Billion Physical-AI Robotics Budget
Japan’s Ministry of Economy, Trade and Industry (METI) allocated ¥32 billion in supplementary budget specifically targeting physical-AI robotics infrastructure. Most Western analysts have not yet incorporated this line item into their Fanuc models.
State-backed demand acts as a floor under Fanuc’s domestic order book — particularly relevant if global capex cycles soften. For a company with Fanuc’s manufacturing cost structure, incremental government orders at scale flow almost entirely to operating income.
2. $90 Million U.S. Factory Expansion
Fanuc announced a $90 million expansion of its U.S. manufacturing footprint. The strategic logic is straightforward: localizing production hedges against tariff escalation on Japanese-manufactured robots shipped to North America.
For US-based investors, this is a direct geopolitical hedge embedded in the company’s own capital allocation. It also positions Fanuc to capture reshoring-driven capex from American manufacturers who need supply-chain certainty.
3. NVIDIA Collaboration and Physical-AI Integration
Fanuc’s deepening collaboration with NVIDIA embeds generative AI capabilities directly into CNC controllers and robot controllers. This is not a press-release partnership — it represents a genuine shift in the intelligence layer of Fanuc’s core products.
As physical-AI moves from research to production deployment, Fanuc’s installed base of CNC and robot controllers — among the largest globally — becomes a distribution channel for AI-driven productivity upgrades. That recurring software and service layer is not yet reflected in consensus earnings models.
Competitive Moat: The Oshino Campus Advantage
Fanuc’s Oshino campus in Yamanashi Prefecture is one of the most vertically integrated manufacturing facilities in global industrial automation. Fanuc designs and manufactures its own servo motors, CNC controllers, robots, and machine tools — all within a single campus ecosystem.
This vertical integration delivers two durable advantages over competitors Yaskawa, ABB, and KUKA: lower component costs (no third-party motor or controller margin), and faster iteration cycles (engineering teams share physical space and can prototype in days rather than weeks).
According to OpenWork (openwork.jp), Fanuc’s employee satisfaction score is approximately 3.6/5 — above the Japanese industrial sector median. High retention among engineers at a campus-based R&D operation is a meaningful proxy for institutional knowledge preservation.
This confirms, rather than undermines, the moat thesis: the people building the robots are staying.
Checking Minkabu (みんかぶ) (minkabu.jp) analyst consensus for 6954 shows approximately 4 strongly constructive view, 5 Buy, and 4 Neutral ratings among tracked analysts, with an average fair-value estimate of roughly ¥8,800 — implying approximately 9% upside from the ¥8,063 reference price.
The domestic analyst skew toward Buy/strongly constructive view suggests Japanese institutional investors are not pricing in the full METI budget tailwind, which reinforces the constructive view here.
Japan Edge: FANUC Buy Discipline From Japanese Primary Sources
The extra edge in this FANUC buy article is not another high-level robotics narrative. It is forcing the 6954 thesis through Japanese primary sources: the company guidance table, the order-book reference material, Tokyo retail valuation pages, and shareholder-return policy.
That filter matters because FANUC can look like a simple “physical AI” winner in English, while the Tokyo case is more cyclical: orders, yen assumptions, China mix, payout math, and valuation all have to line up before a premium multiple is justified.
FANUC’s FY2025 results materials, released April 24, 2026, provide the base year. For the fiscal year ended March 31, 2026, the company reported net sales of JPY 857.831 billion, operating income of JPY 183.763 billion, ordinary income of JPY 227.485 billion, and parent net income of JPY 166.543 billion.
The same release guided the fiscal year ending March 31, 2027 to JPY 909.6 billion in net sales, JPY 212.2 billion in operating income, and JPY 184.9 billion in parent net income.
The operating-income guide is the article’s headline hook, but the Japan Edge is checking what sits underneath it. FANUC’s FY2025 reference material showed fourth-quarter orders by region with China at 31.3%, the Americas at 24.3%, Japan at 13.6%, Europe at 14.9%, and Asia excluding China at 14.6%.
Total orders were up 19.2% year over year, while China orders were up 55.2%. That makes China quality the key test: a broad factory-automation recovery is investable, but a narrow China restock can reverse quickly.
Currency is the second local check. FANUC’s FY2026 forecast used average assumptions of 150 yen per U.S. dollar and 170 yen per euro. A U.S. investor buying FANUY or Tokyo-listed 6954 should not treat that as a footnote. Yen moves can affect reported profit, Tokyo-share returns translated into dollars, and the perceived value of dividends after Japanese withholding tax.
| Local source | Data point to verify | Reader takeaway |
|---|---|---|
| FANUC FY2025 annual results | Net sales JPY 857.831bn; operating income JPY 183.763bn; ordinary income JPY 227.485bn; parent net income JPY 166.543bn | The buy case starts from a recovered, profitable industrial base, not only from AI language. |
| FY2026 company forecast | Net sales JPY 909.6bn; operating income JPY 212.2bn; parent net income JPY 184.9bn | The +15.5% operating-income story needs follow-through in quarterly orders and margin conversion. |
| Regional order mix | FY2025 Q4 orders: China 31.3%, Americas 24.3%, Japan 13.6%, Europe 14.9%, Asia ex-China 14.6% | The cleanest bullish read is broadening demand; the weakest read is a short China restock. |
| FX assumptions | FY2026 forecast assumes 150 yen/USD and 170 yen/EUR | Dollar-based investors should model Tokyo-share return and currency translation separately. |
| Shareholder returns | Consolidated payout-ratio policy of 60%; FY2025 annual dividend JPY 107.09 per share; April 2026 buyback announced at up to JPY 50bn | Cash return supports the stock, but the dividend is earnings-linked rather than bond-like. |
| Minkabu 6954 | Domestic snapshot of price, reference value, PER, PBR, market cap, and local sentiment | Use Japanese retail valuation mood to check whether the recovery is already priced in locally. |
Buy Watchlist for 6954
- Orders before sales: compare each quarterly order update with the JPY 909.6 billion FY2026 sales forecast before assuming the guidance is conservative.
- China durability: require evidence that the 55.2% year-over-year China order increase is turning into profitable shipments, not only a one-quarter inventory rebuild.
- Margin conversion: the operating-income forecast implies better leverage; if sales rise but operating margin stalls, the premium multiple deserves a haircut.
- Dividend and buyback math: the 60% payout policy and JPY 50 billion buyback are helpful, but both depend on earnings and capital allocation discipline.
- FX translation: test the investment in yen and dollars because a strong Tokyo return can still disappoint a U.S. holder if USD/JPY moves against them.
Reader Takeaway
FANUC can be a valid buy candidate for a U.S. investor who wants Japanese automation exposure, but only if the thesis is anchored in the Japanese data rather than the broad physical-AI story.
The clean buy signal is orders broadening beyond China, operating income tracking toward JPY 212.2 billion, and cash returns staying aligned with earnings.
The caution signal is a stock that keeps pricing in perfect execution while China orders fade, yen assumptions move against guidance, or Tokyo retail sentiment already treats the recovery as obvious.
Segment Breakdown: Where the Risk Lives
Fanuc operates across three primary segments: Factory Automation (FA / CNC), Robots, and Robomachines (wire EDM and injection molding machines).
The Robot Division represents approximately 45% of total sales. This segment carries the heaviest China exposure in Fanuc’s portfolio. China remains the world’s largest market for industrial robots, and Fanuc has historically captured significant share there.
The risk is binary in character: if US-China trade tensions escalate materially, Chinese manufacturers may accelerate substitution toward domestic robot brands (Estun, SIASUN), and Fanuc’s FY2027 guidance could face downward revision. This is the single most important variable to monitor.
The FA/CNC segment, by contrast, is more diversified geographically and benefits from the Japan domestic capex cycle, which METI’s physical-AI budget directly supports.
Valuation: Is 35–38x PER Justified?
At a PER of 35–38x on forward earnings, Fanuc trades at a premium to the broader TSE Prime market. The question is whether that premium is earned.
The case for yes: double-digit earnings growth guidance, a ¥50B buyback, METI tailwinds, and an NVIDIA AI collaboration that could unlock a recurring software revenue layer not in current models. The JPX TSE corporate governance data also shows Fanuc has been responsive to the TSE’s PBR improvement requests, with buybacks and improved capital allocation disclosures.
The case for caution: China exposure at 45% of the Robot Division, a macro environment where global capex could soften, and the fact that the NVIDIA collaboration is still early-stage. A de-rating toward 28–30x PER on a China demand shock would imply meaningful downside from current levels.
The author’s fair-value estimate of ¥8,500 on a 12-month basis assumes the FY2027 guidance holds and the METI budget flows through to domestic orders in H2 FY2027. It does not assume further multiple expansion.
For chart-based investors tracking Fanuc’s price history and RSI levels, TradingView provides clean access to 6954.T with full Japanese market data.
Dividend Profile for US Income Investors
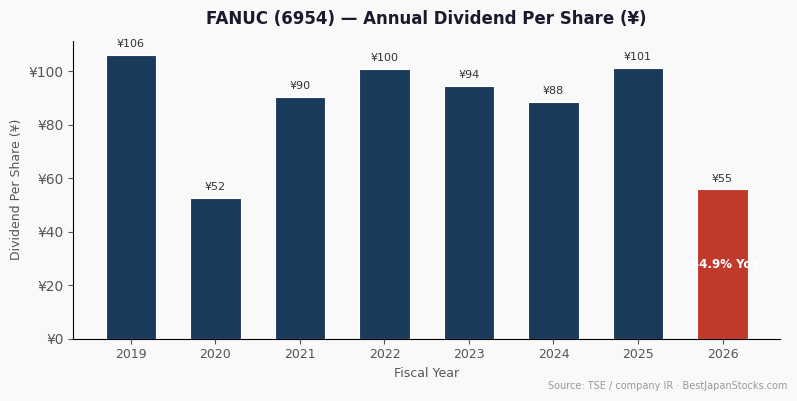
Fanuc’s dividend yield of approximately 1.33% is modest by Japanese dividend stock standards. However, the company has maintained consistent dividend payments through cyclical downturns, and the April 2026 ¥50B buyback signals a broader shareholder return commitment beyond the headline yield.
Fanuc pays dividends twice per year (interim and year-end). For US investors, the practical yield after Japanese withholding tax (15.315% (Japan’s statutory withholding; the U.S.–Japan treaty rate is 10% where properly documented) as applied by brokers) is approximately 1.4–1.5% before claiming the IRS Form 1116 foreign tax credit.
The Fanuc Japanese-language dividend history page shows the per-share dividend trajectory clearly. The dividend payout ratio has remained conservative, leaving room for increases as FY2027 earnings growth materializes.
For US investors building a Japan dividend portfolio, Fanuc is better framed as a total-return compounder with a modest income component, rather than a pure yield play. The earnings growth and buyback story is the primary driver.
Risks and Counter-View
A balanced view requires acknowledging the three most credible counterarguments:
- China demand contraction: The Robot Division’s ~45% sales weight and China concentration means any sustained PRC industrial slowdown or trade-war escalation could force a FY2027 guidance cut. Domestic Chinese robot brands are gaining capability rapidly, which is a structural — not cyclical — threat.
- Valuation sensitivity: At 35–45x PER, Fanuc has limited margin for error. A single guidance miss could trigger a sharp de-rating. The stock has historically been volatile around earnings releases, with the 52-week range of ¥3,650–¥8,880 illustrating the amplitude of sentiment swings.
- NVIDIA collaboration execution risk: Physical-AI integration into CNC and robot controllers is technically complex. Delays in productizing the NVIDIA collaboration could push the recurring software revenue thesis out by 12–24 months, during which the premium multiple becomes harder to defend.
Bottom Line — Author’s View: Constructive
Fanuc’s FY2027 operating income guidance of ¥212.2 billion (+15.5% YoY) is not a routine beat — it is a convergence of three structural catalysts that most English-language analysis has not yet fully priced in.
At a ~21.4% operating margin, a ¥50B buyback, METI’s ¥32B physical-AI budget flowing into domestic orders, and an NVIDIA collaboration that could unlock a software revenue layer, the constructive case is numerically grounded.
The author’s fair-value estimate of ¥8,500 assumes FY2027 guidance holds and does not require multiple expansion. The primary risk — China exposure in the Robot Division — is real and must be monitored. Position sizing should reflect that binary tail risk.
For US investors seeking Japan industrial exposure with a genuine compounding narrative, Fanuc at current levels offers a more defensible entry than the headline PER suggests — provided China trade conditions do not materially deteriorate.
Frequently Asked Questions
What is Fanuc’s current dividend yield and payout frequency?
Fanuc (6954) currently yields approximately 1.33% based on a share price of ¥8,063 (May 2026). The company pays dividends twice per year — an interim payment and a year-end payment. The payout ratio remains conservative relative to earnings, leaving room for increases as FY2027 guidance materializes.
What withholding tax do US investors pay on Fanuc dividends?
Japanese brokers typically apply a 15.315% withholding tax on dividends paid to US investors. US investors can claim a foreign tax credit on IRS Form 1116 to offset this against their US tax liability. Consult a tax professional for your specific situation.
Is Fanuc suitable for a US IRA or retirement account?
Fanuc can be held in a US IRA through brokers with TSE access (IBKR, Saxo). However, note that foreign tax credits (Form 1116) cannot be claimed inside a tax-deferred IRA — the 15.315% Japanese withholding is an unrecoverable cost in that account structure.
For income-focused IRA investors, this effectively reduces the net yield to approximately 1.4–1.5%. The total-return compounding thesis is less affected.
How to Buy 6954 from the U.S.
Fanuc (6954) trades on the Tokyo Stock Exchange, with an OTC ADR also available in the US under the ticker FANUY. U.S. investors can access shares on the TSE directly through international brokers such as Interactive Brokers or Saxo Bank. For step-by-step brokerage setup, ADR vs. direct TSE shares, and U.S. tax handling, see our complete guide: How to Buy Japanese Stocks from the U.S..
Key Primary Sources: ファナック IR(日本語) | ファナック 配当履歴 | EDINET 有価証券報告書 | Minkabu (みんかぶ) 6954 アナリスト予想 | OpenWork 従業員評価 | METI (English) | JPX / TSE Corporate Governance Data | Japan Robot Association (JARA)
Disclaimer: This article is for informational purposes only and does not constitute investment advice. Opinions are my own, not investment advice. I do not currently hold positions in securities discussed. Past performance is not indicative of future results. Please read our full Disclaimer before making any investment decisions.
Per FTC 16 CFR Part 255, any material connections or potential conflicts of interest are disclosed therein. Data snapshot: May 2026; page maintenance review: July 10, 2026.